In the 2014 Gartner article titled; “Magic Quadrant for Business Intelligence and Analytics Platforms” IBM and Tableau led the pack in “Completeness of Vision” and “Ability to Execute” respectively.
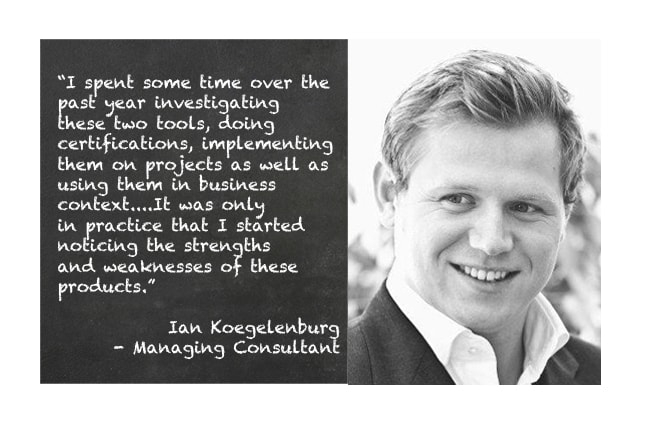
I spent some time over the past year investigating these two tools, doing certifications, implementing them on projects as well as using them in business context. I dealt with many sales people, biased customers and resistant consultants who constantly defended their respective camps and undermined the opposing. It was only in practice that I started noticing the strengths and weaknesses of these products.
Before I explain my disposition, let’s put some context down.
I have seen various diagrams of analytical maturity, pyramids on data governance and infographics outlining the organisations of the world. Below is my take on it.![]()
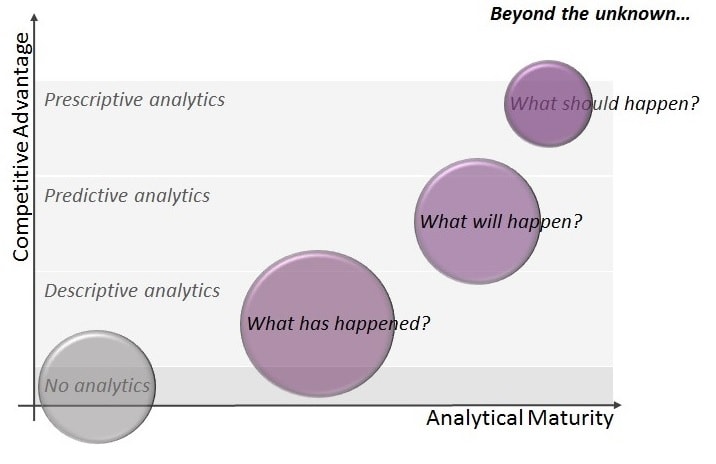
![]()
The diagram is quite self-explanatory, but in essence it is showing that all organisations should strive for data driven decision making through the use of descriptive, predictive and prescriptive analytics. The size of the globes is a rough indicator of where the majority of 21st century companies are; descriptive analytics. There is nothing wrong with being in this domain, in fact it is an essential part of “analytical maturity” and should command significant attention.
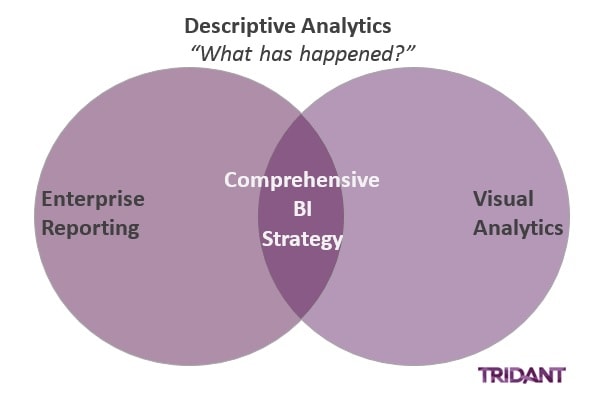
In brief descriptive analytics is a rear-view mirror of your business, asking; “What has happened?” Organisations are measuring Key Performance Indicators (KPI’s) and business metrics to eventuate strategic or managerial decisions. This is a very important part of the analytics puzzle and it is important to define a comprehensive BI or descriptive strategy before or as part of getting to the predictive and prescriptive layers.
Now that the landscape has been defined, let’s circle back to the concepts of “Enterprise Reporting” and “Visual Analytics.”
Enterprise reporting has been around for quite some time and there are many companies doing this really well. Its power lies in the creation, distribution and consumption of enterprise grade, highly curated dashboards, balanced scorecards and metric reports. IBM Cognos BI has been a stalwart in this space for decades and it is no surprise that it leads the market in “completeness of vision.”
Visual analytics on the other hand is the “new-kid” on the block. Wikipedia defines it as; “an outgrowth of the fields of information visualization and scientific visualization that focuses on analytical reasoning facilitated by interactive visual interfaces.”
Simply put, it helps people see and understand their data. The highly visual graphic users interfaces (GUI), allow users to quickly connect many disparate and hard to access data sources. A User can then immediately ask questions of that data by dragging and dropping objects onto a canvas. In essence it is a discovery platform, which focuses on the visualisation of data to uncover previously hidden insights. Tableau is the outright market leader and ranks the highest for “ability to execute.”
The fundamental difference between these two products is at inception. Typically when there is a requirement for enterprise reporting, companies know what they want to see, have predefined metrics and know the intended audience. The inverse is true for visual analytics. At inception the analyst or data scientist does not necessarily know what the outcome will be or what exactly it is they are looking for. Fundamentally both these products are retrospectively asking questions about the organisations, but approaching it from completely different angles. This is why I believe these products should be used collaboratively to deliver a complete BI or Descriptive strategy.
I need to caveat this post by stating that there are no guarantees that these two types of products will not play in one another’s respective domains in the future. I believe it is inevitable that one day there will be one product which offers the full range of functionality required to deliver an effective descriptive analytical strategy, but for the time being organisations should not chuck the proverbial “baby out with the bath water.” There is immense value in embracing both visual analytics and enterprise reporting as symbiotic technologies.
If you would like further details on what some of the key differentiating factors are and possibly an in-depth analysis on the strengths and weaknesses of some of the other available products, or need help in defining a comprehensive BI strategy please do not hesitate to get in contact.
Sayonara Data Nerds.
Copyright © Tridant Pty Ltd.