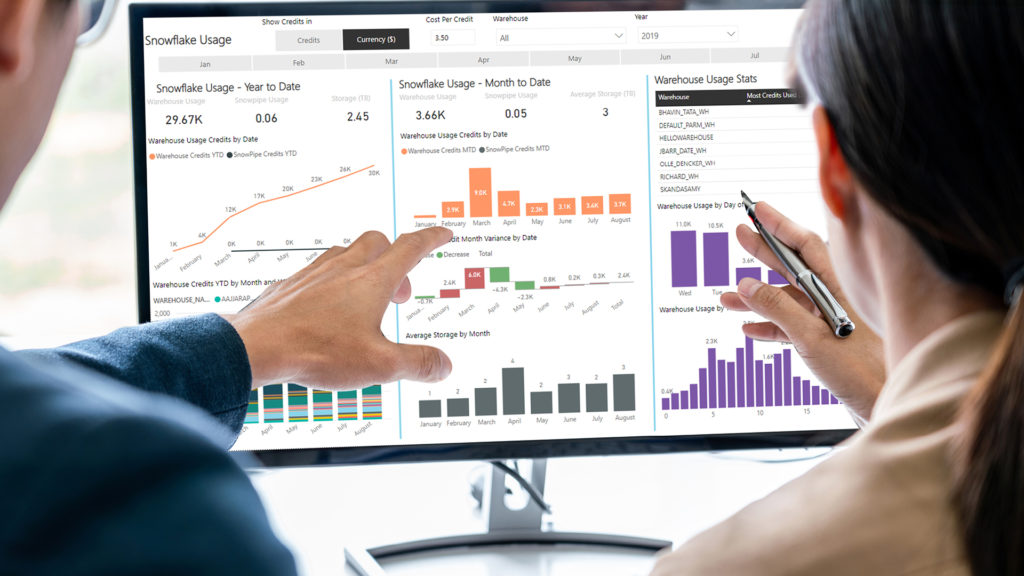
We are often asked by clients, when initiating their Snowflake cloud data warehouse journey, “what will our monthly costs be?” Snowflake offers useful cost calculators but these cost estimates only provide an indication based on assumed usage parameters at the time.
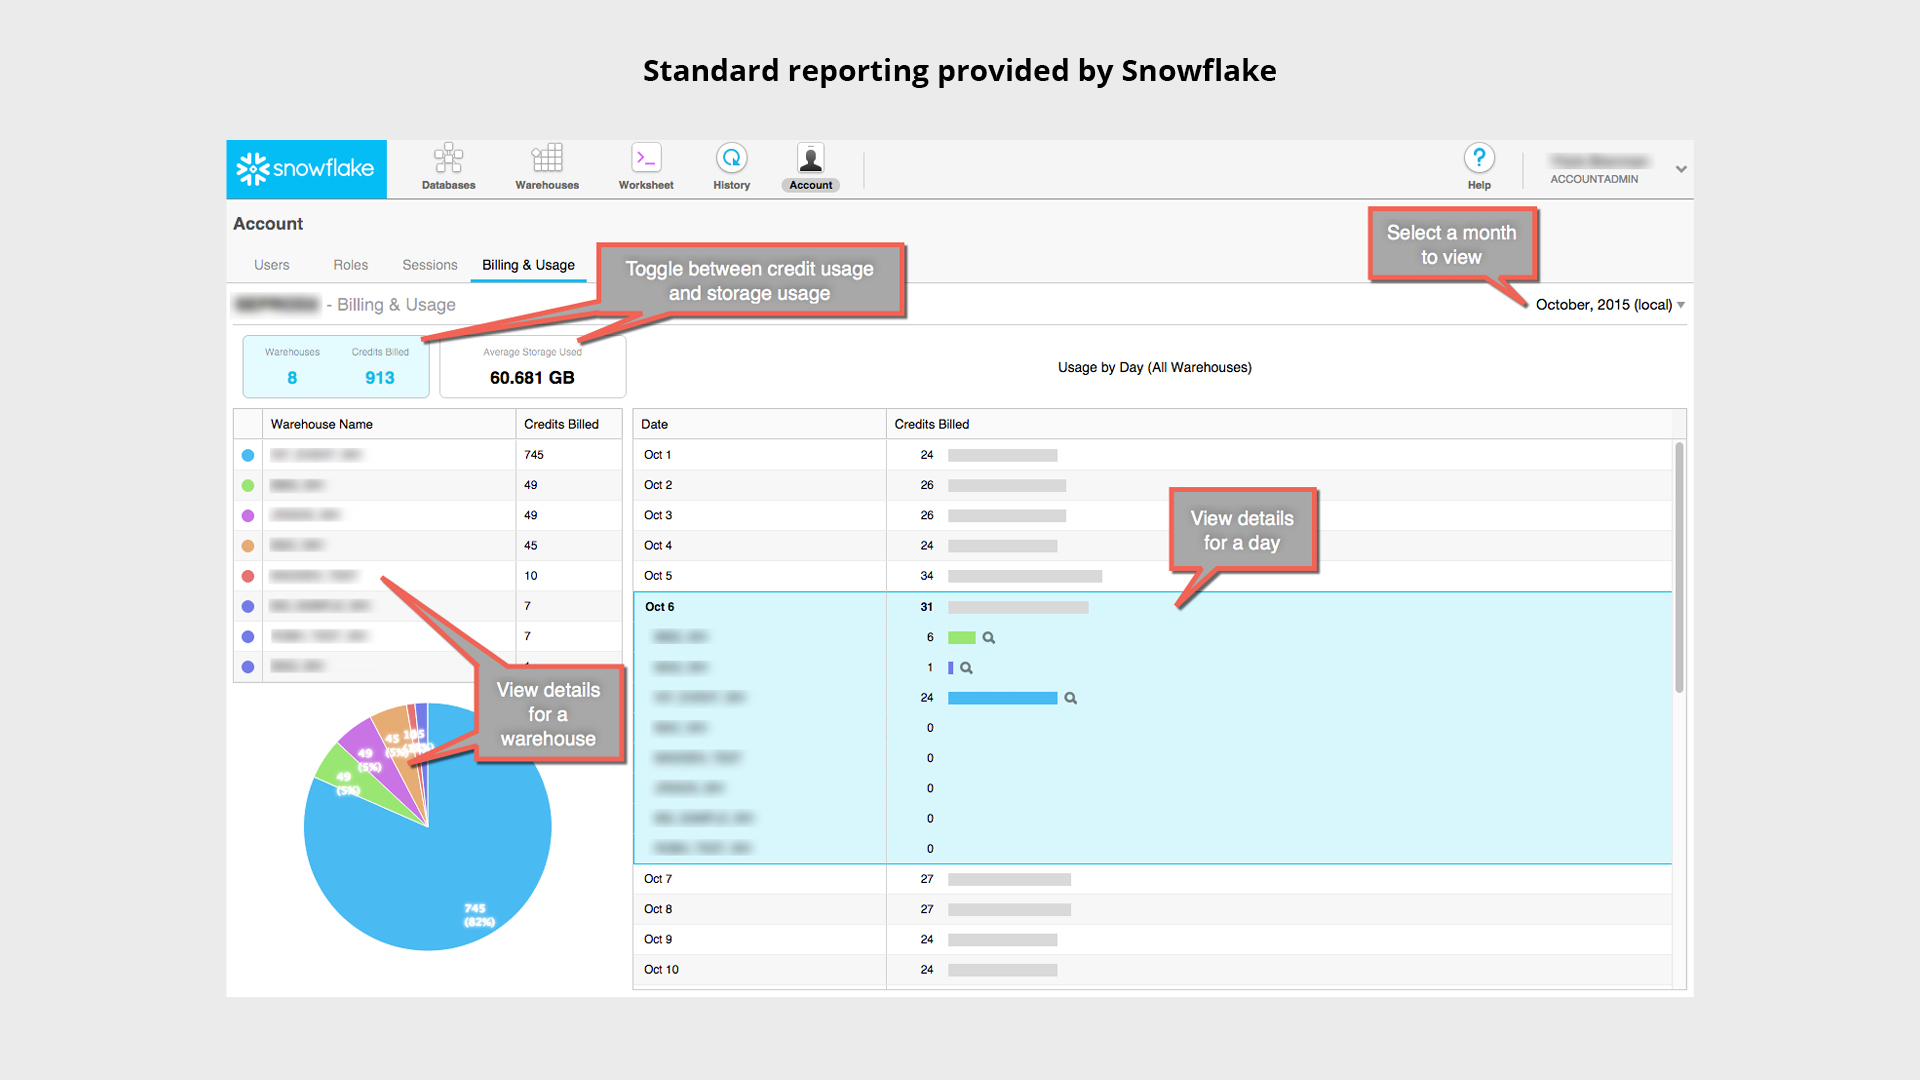
Snowflake cost calculators surface usage and costs, available to the account administrator role under the Account > Billing & Usage tab. These insights are largely presented as data, not as historical trends. As a result, this excludes in-depth analysis of the various parameters that affect usage and costs, and levers you can pull to control them.
It is only when your users actually begin using Snowflake that businesses begin to have a real understanding or expectation of their monthly and yearly expenditure.
It is both an exciting and nervous time for IT stakeholders, as they watch the company use data in ways never before possible, acquire new data sets that add value to the business, whilst also waiting in anticipation for the first usage bill.
Rest assured, Snowflake does a good job of making the usage statistics and costs easily visible via their standard interface. However, some organisations may need more detail: IT Infrastructure leads and business sponsors of initiatives that leverage Snowflake to achieve important business outcomes would need to review usage statistics and costs on a more frequent basis.
Data analytics tools provide deeper insight on Snowflake costs and usage. This is where data analytics tools come into play. Most of the leading data analytics tools integrate seamlessly with Snowflake and make the entire process of connecting to both business and internal Snowflake cost and usage data, and providing value through reporting, and analysis an easy one.
Power BI, Tableau, and Qlik have done a stellar job with integration into Snowflake’s data layer and crucially, presenting Snowflake usage statistics in a visually compelling manner.
Power BI, Tableau and Qlik, and the user communities within these tools help deliver visually compelling usage dashboard templates, which in essence become a plug-tweak-play setup so that the business can quickly and easily monitor additional spending behaviour metrics including:
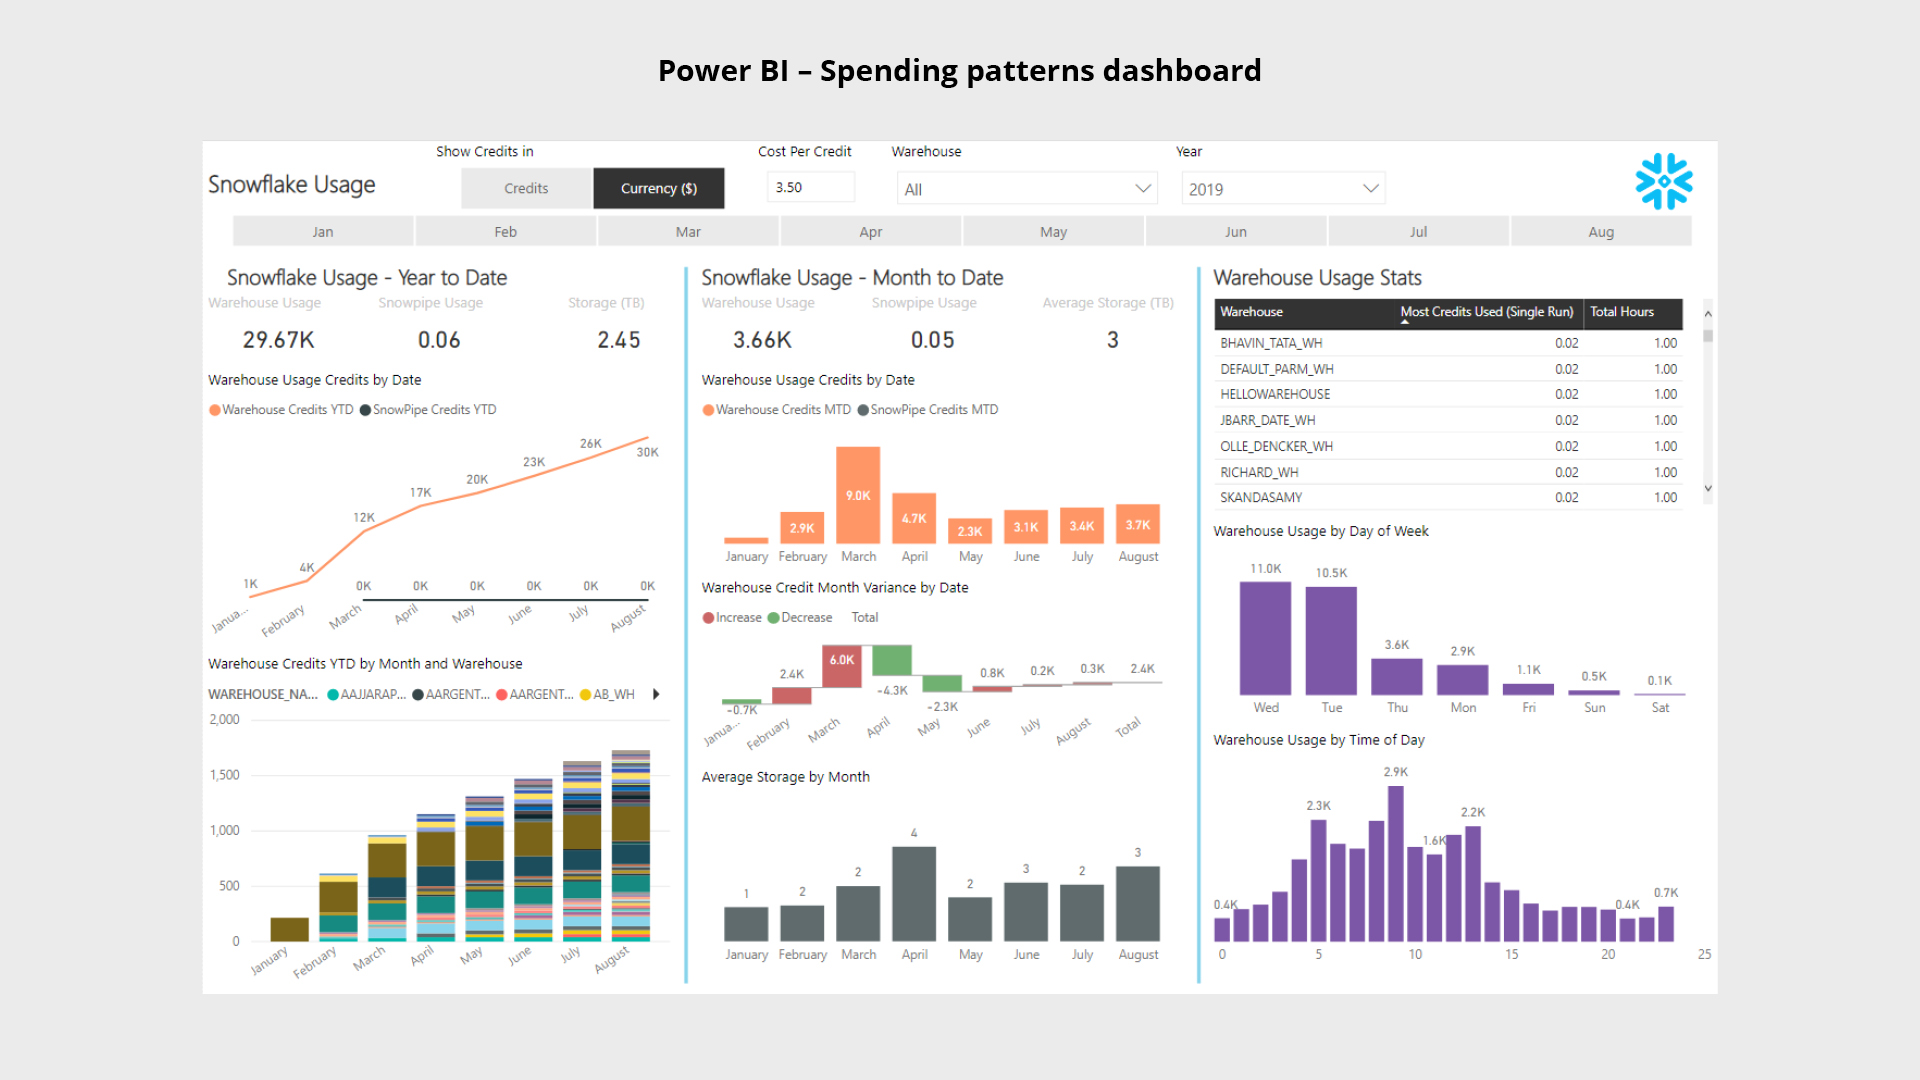
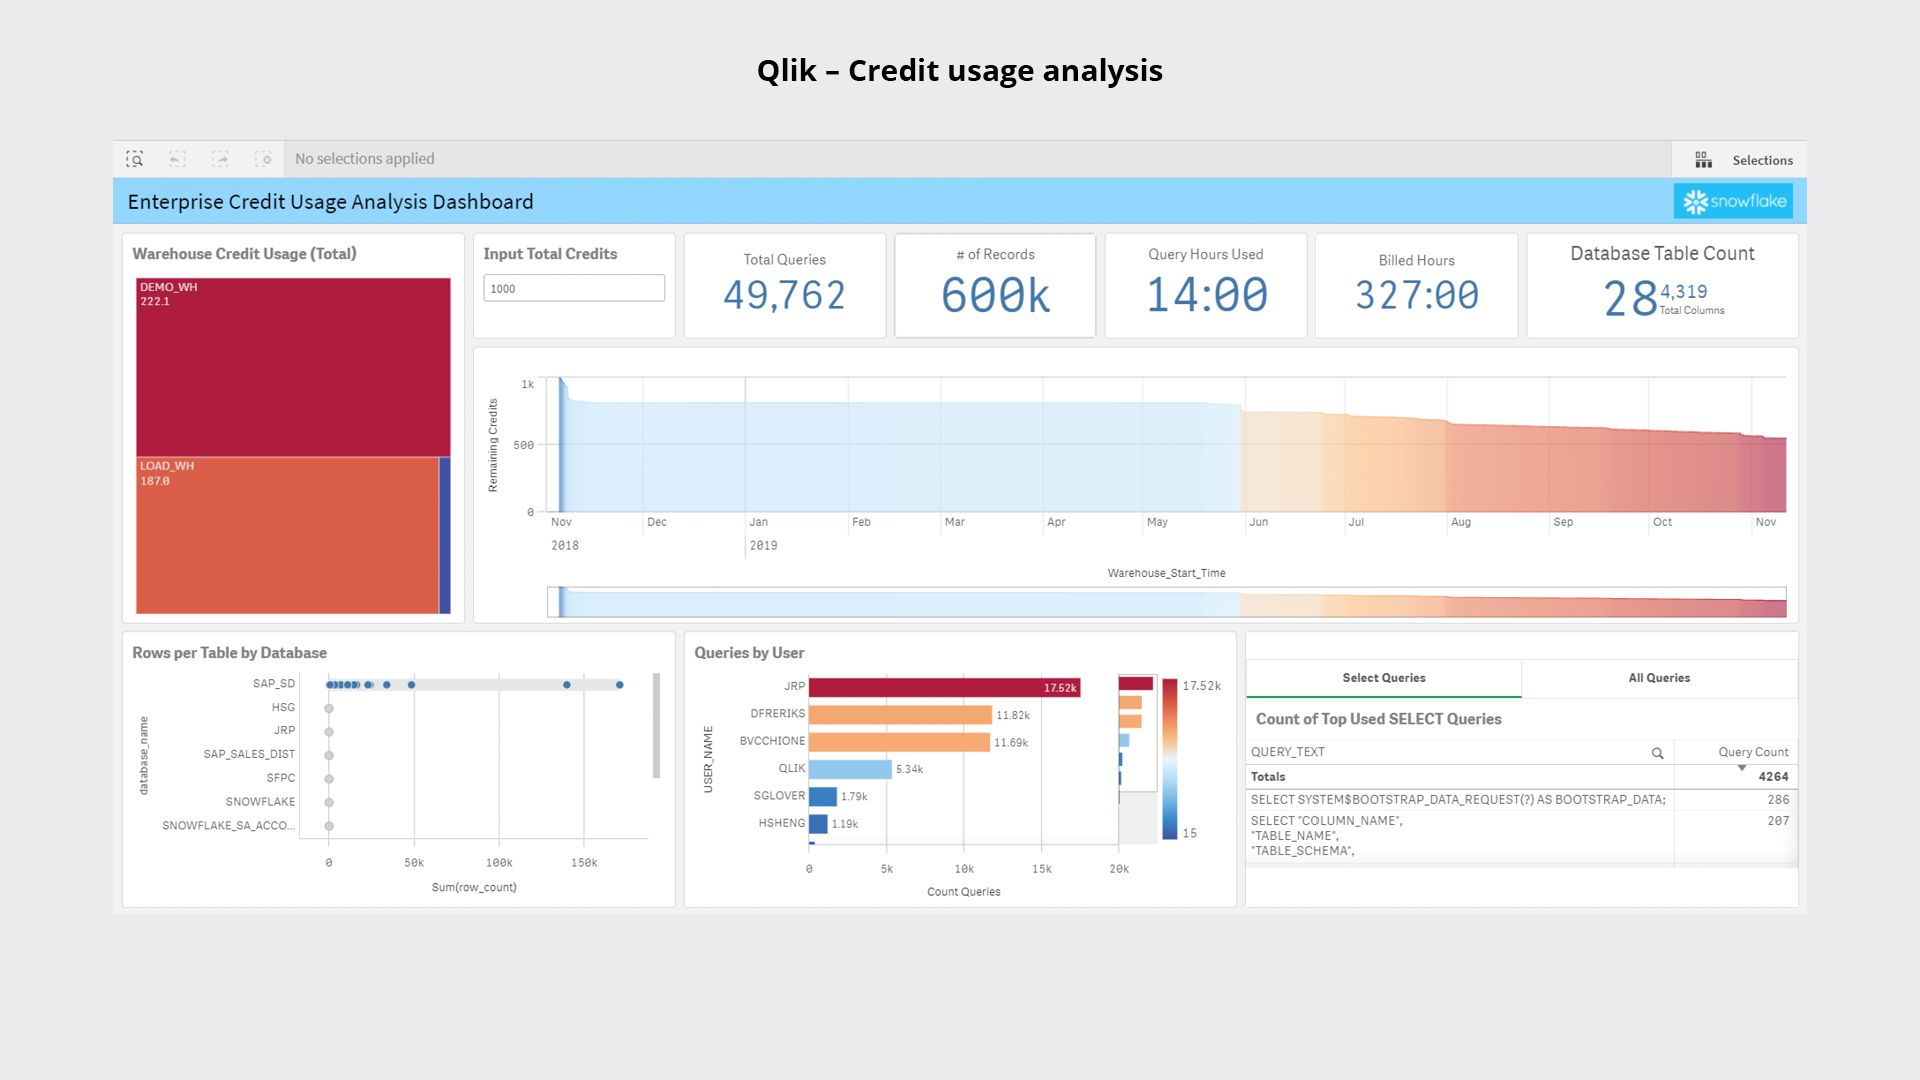
With dashboards being multilayered, users are enabled to easily view and drill down to analyse data that is important to them. Whilst there is a focus on spend, particularly in the first few months, this often transitions into what can be fine-tuned to improve cost efficiency, prioritise performance or enforce cost controls, depending upon business need.
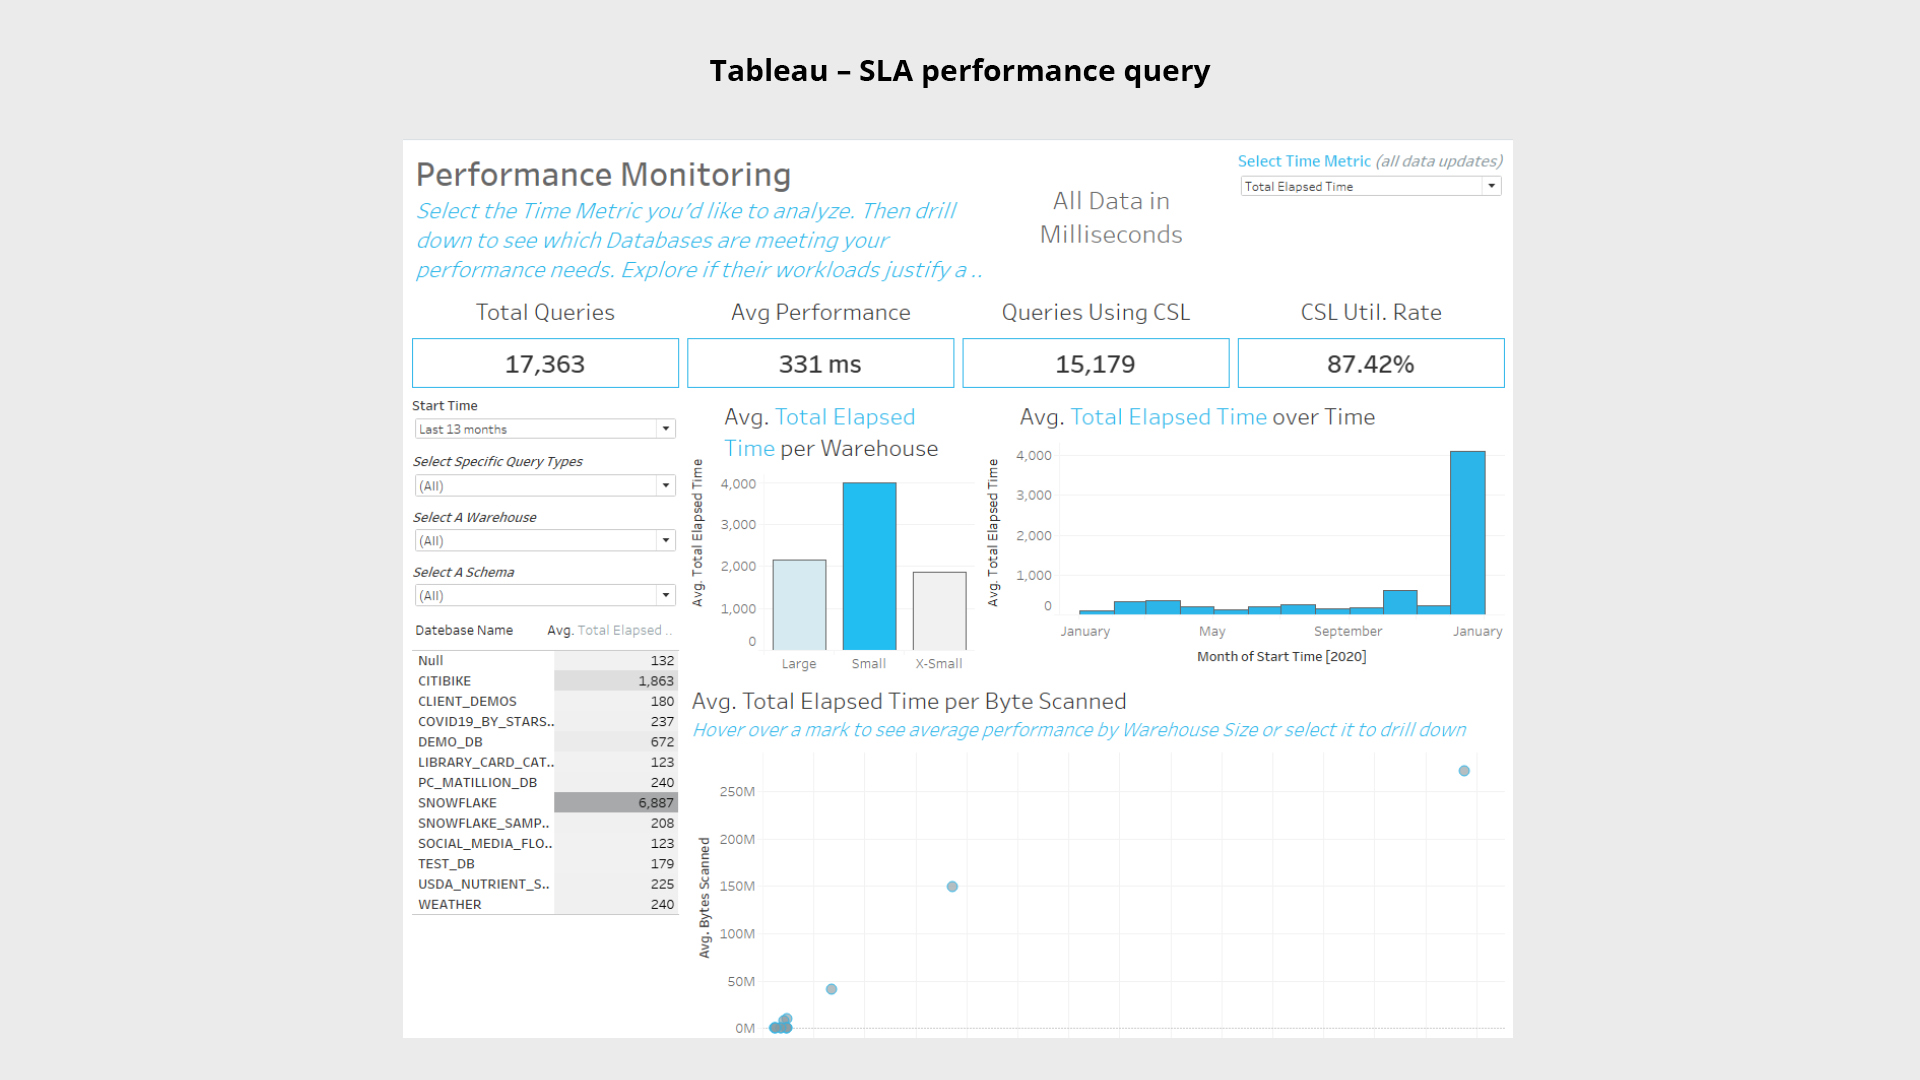
By analysis of the performance, any related SLAs established at the time of project initiation can be monitored. If workloads fall outside of any set SLAs, Snowflake could be optimised with a different warehouse, for example.
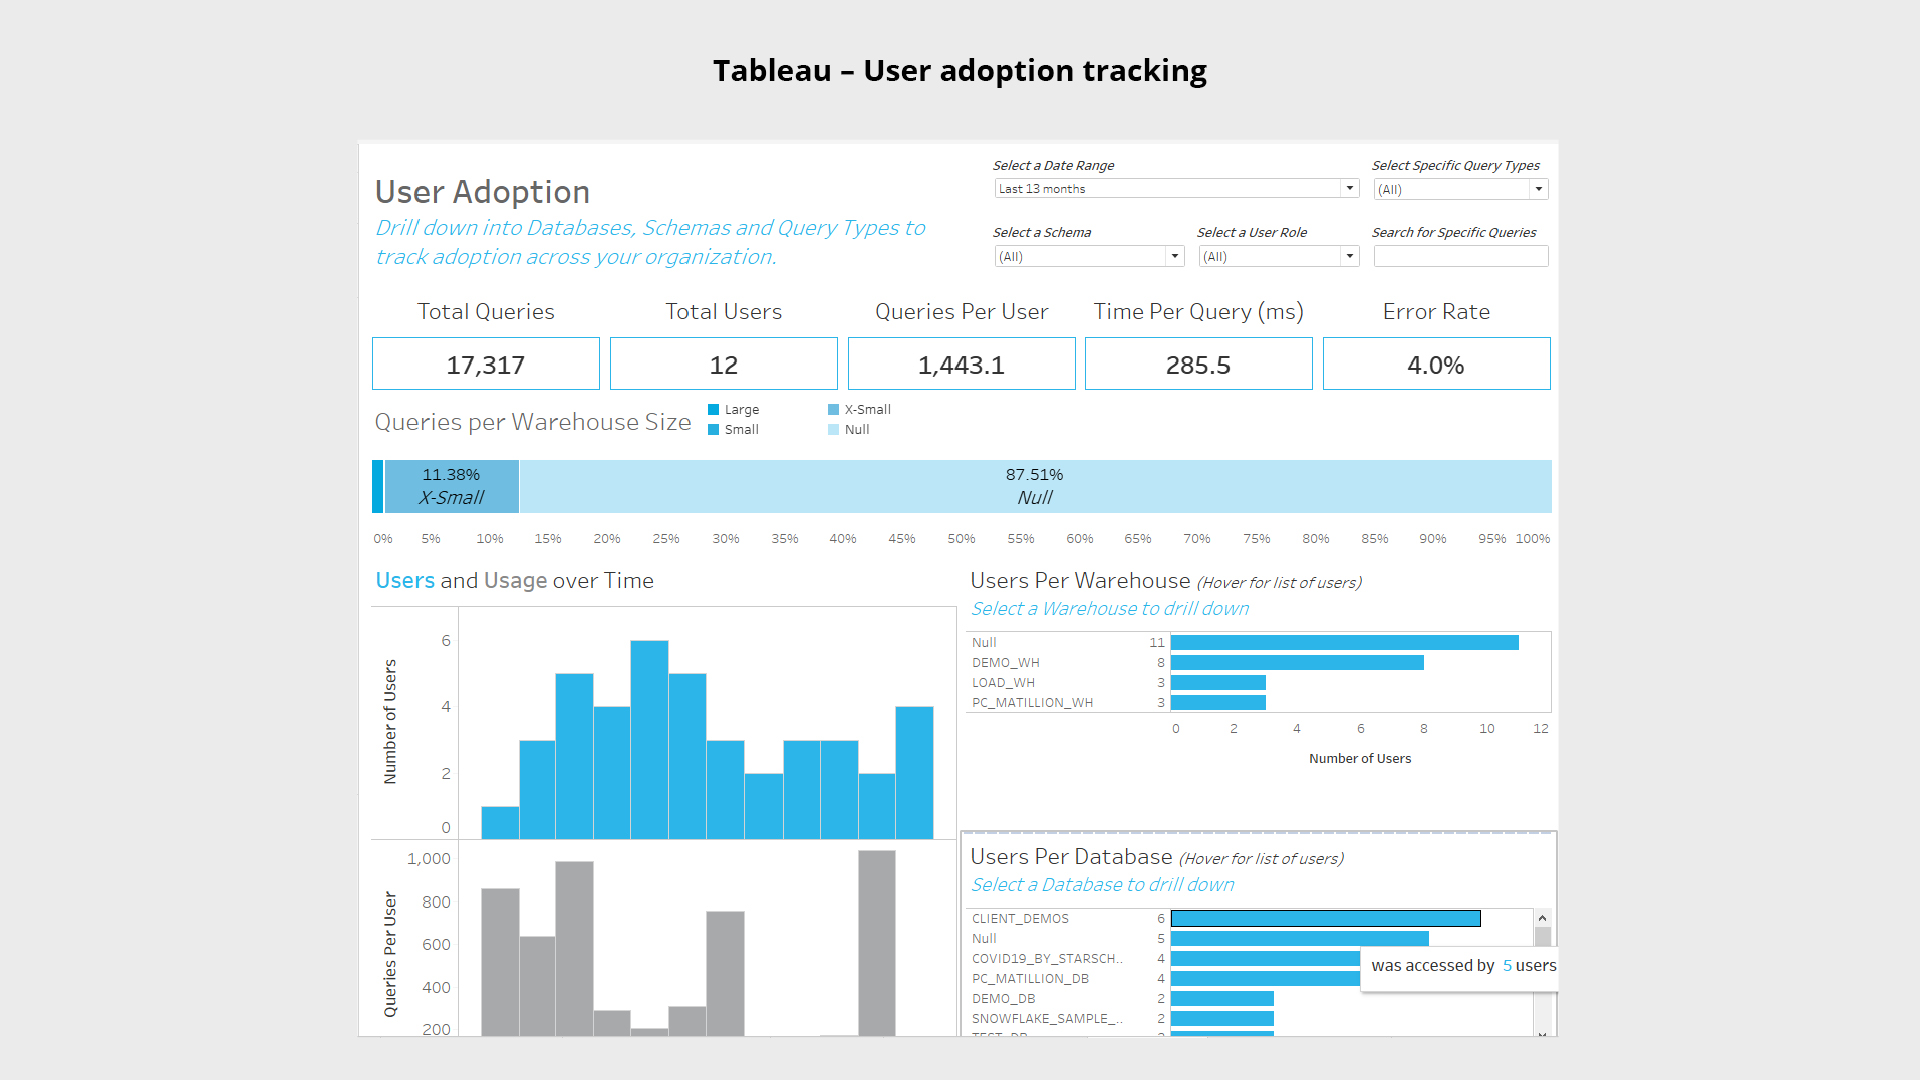
Similar value can be gained by reviewing user and team usage patterns by analysing how data is used. Adoption of the new system is key when quantifying monthly spend. Certain areas of the business will be better at adapting to change than others. With a closer eye on knowledge gaps, training and treatment plans may help teams better realise the value of your data investments.
Owning a modern cloud data warehouse such as Snowflake and integrating with leading data analytics tools will enable the business to derive greater value from its investment by demystifying usage behaviours and costs.
Dashboard templates made available by Power BI, Tableau, Qlik, or those developed by user communities, can be modified or extended to suit your business needs and plugged into your Snowflake instance.
Critically, configuration is required to expose the Snowflake backend statistics, requiring technical expertise to build out. The plug-tweak-play solutions accelerate configuration, rather than starting from scratch, and empower businesses to monitor Snowflake usage and costs, quickly and seamlessly.
Smarter analytics, emerging technologies, better business.
Oswald Almeida | Michelle Susay
Copyright © Tridant Pty Ltd.