
Tableau empowers users to better see and understand their data through powerful visualisations, while Anaplan provides a cloud financial planning platform that connects data, people, and plans in every part of your business.
Not many people realise that Tableau and Anaplan are very complimentary and when used together can actually be a magic combination for presenting your plans and results to your audience.
The Tableau to Anaplan connection is a supported datasource for Tableau, allowing you to use your Anaplan logon to connect to an Anaplan Action of your data. Existing users of both software can immediately connect following the guide.
Tableau themselves have implemented Anaplan within their organisation in a bid to improve the accuracy of their workforce planning and operations data and minimise calls, emails and meetings across their organisation. Since implementing the software, Tableau’s data visualisation tools have been presenting information that has been calculated by Anaplan’s planning and performance platform, thereby freeing up time for value-added processes instead of manual consolidations of data. You can read more on the tableau blog here.
At the recent Anaplan Hub 2018, Tableau’s Senior Finance and Sales Planning leaders presented two sessions for the audience on “Running the table—Tableau’s secret weapon to optimise sales planning” and “Connected planning at Tableau: Using Anaplan and Tableau together” which goes to show that Tableau themselves are big believers in the impact Anaplan can have in the Finance, HR and sales Planning departments.
Even though users are able to create dashboards and visualisations in Anaplan, integrating Anaplan with Tableau allows the planners within an organisation to benefit from access to additional visualisations and capabilities that are available in Tableau, while still being able to take the full advantage of the flexibility and robust planning capabilities of Anaplan.
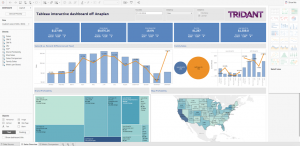
As an example, Tridant’s expert Data Visualisation Consultant, Ariane Costa, created an live interactive Dashboard in Tableau on the Anaplan S&OP Apphub model. The Tableau dashboard can identify historical trends through filters including Family Sales, Brand Profitability or Map Profitability. It also allows users to make trend comparisons by selecting two different metrics from the dropdown filter.
The outcome from the powerful synergy of these two tools is optimal decision-making and for you to be an ambassador of strategy in your own organisation.
The Tridant team will have a booth at the Tableau Data Day Out this Thursday May 24. If you would like to check out how Tableau and Anaplan work together then please come along and see us for a chat. Tridant will also be offering the opportunity to enter the draw to win a Sonos One Bundle. Sonos themselves are in fact an Anaplan customer and their journey to Connected Planning can be read here: https://www.anaplan.com/customers/sonos/.
If you are unable to make the Tableau Data Day Out, Tridant will also be holding a webinar on July 11th to take you through the magic combination with live demos.
For more information about our Tableau and Anaplan Solution offerings, please reach out to us at info@tridant.com.
Copyright © Tridant Pty Ltd.