
Today’s blog is all about a very annoying issue faced when you divide a numerator by either a 0 or an almost negligible denominator. The result is either a null or a blown up percentage figure which distorts real life situations. I faced this exact issue when I needed to display a company’s GPM% for each of their Construction projects. I mocked up a simple dataset to illustrate this and how I went about solving it. Let’s take a look.
Here I have two measures; Revenue Budget ($M) and GPM Budget ($M)…
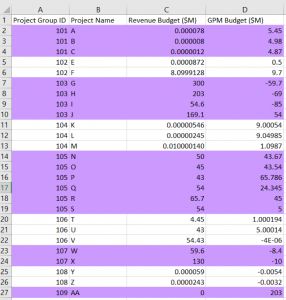
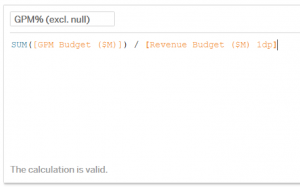
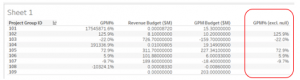
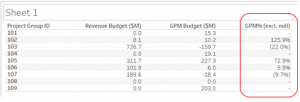
To get the GPM%, I’ll write a calculated field in Tableau; SUM([GPM Budget ($M)]) / SUM([Revenue Budget ($M)]). The result in Tableau is:
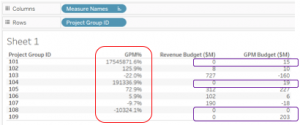
I’ve also included the two measures to illustrate the absolute values of the measures and to get an idea of weighting. Notice that in the Project Group IDs boxed in purple, I’ve deliberately excluded the decimal points so that Revenue Budget is displaying as ‘0’ to illustrate how easily we may get confused with this display (i.e. such small inputs yielding such blown up %s).
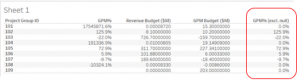
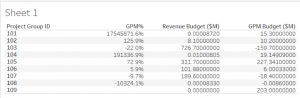
The blown up %s are caused by dividing the numerator by a negligible denominator value, so we’re not actually dividing by 0 in some cases. Here it is again but this time with all dps displayed:
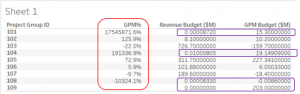
What you’ll also notice is that only Project Group ID 109 is the one with the true 0 denominator and hence displays as a blank / null under GPM%.
a. The client specified that where the denominator, Revenue Budget ($M) = 0.0 when rounded to 1dp, they would like to treat it as if it were a zero and to display the % as a dash (-), in other words to not display the % at all
b. Where the denominator actually is 0, force the blank to be displayed as a dash (-)
c. Where the % yields a negative value, instead of -x show it as (x)
Step 1.
Create a new calculated field that forces the denominator to treat itself as null where it equals 0 when displayed in 1dp, i.e.
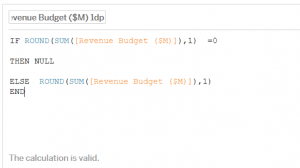
Rename the new calculated field “Revenue Budget ($M) 1dp”.
Step 2.
Create a new GPM% calculated field where you’ll replace the previous denominator with the revised one (Revenue Budget ($M) 1dp), i.e.
And now if you place the new GPM% into the view it’ll look like:
Step 3.
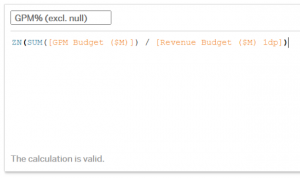
Because the ultimate goal is to force the % to show a dash (-) instead of a blank / null in the cells (as blank values mislead the Business into thinking that the data is incomplete which isn’t the case), we’re going to modify the “GPM% (excl. null)” by wrapping the formula in a ‘zn’ which forces it to recognise nulls as a ‘0’:
Result of which is…
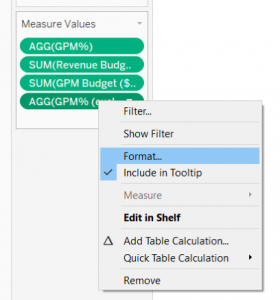
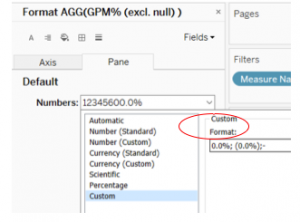
We’re now going to format the GPM% (excl. null) as such:
Right click on “GPM% (excl. null)” -> Format -> Under ‘Pane’ select dropdown until you find Custom, and type in a custom format: 0.0%; (0.0%);-
(Explanation: <Where positive>; <Where negative>; <Where nil>)
By now you would’ve met the client’s briefing as explained above, and generate the desired result:
After:
Before: ☹
Stay tuned for more real life use cases. If you would like the packaged workbook with the dataset, please email me at ana.yin@tridant.com.au.
Copyright © Tridant Pty Ltd.