
IBM Planning Analytics Workspace (PAW) is the new front end for TM1 which assists in creating dashboards and visualisations via just drag and drop. PAW is available today for Planning Analytics customers and hopefully available in 2017 for on-premise customers.This Part 2 of our deep dive series into IBM Planning Analytics will look at some valuable tips for unlocking some of the best new features and visualisations.
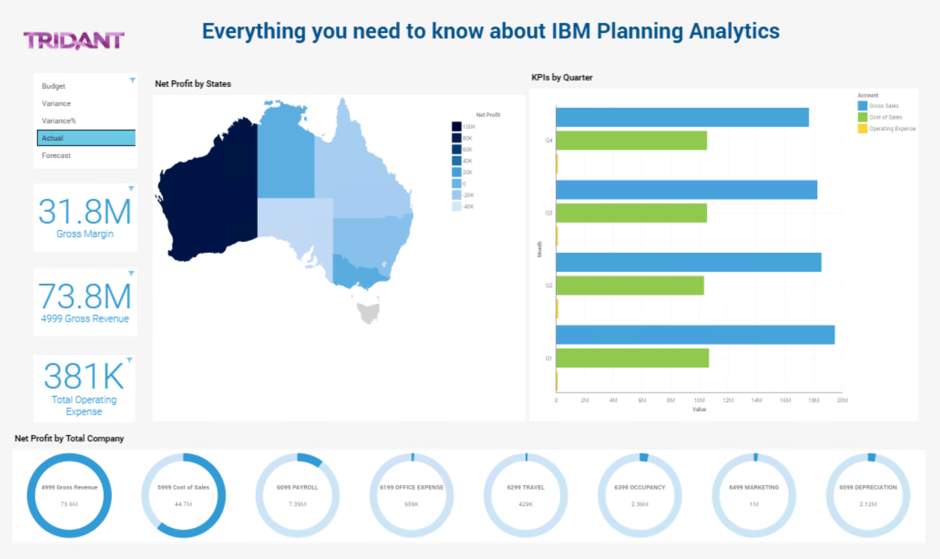
Out of the many visualisation options in Planning Analytics, it is the map visualisations on key metrics that is my favourite and has generated huge interest from clients. Of course the sample data, like most vendor products, shows a US map which often leads to the question from customers: “Can we have map visualisations for Australia?”. The answer is Yes and this blog will guide you through everything you need to create these.
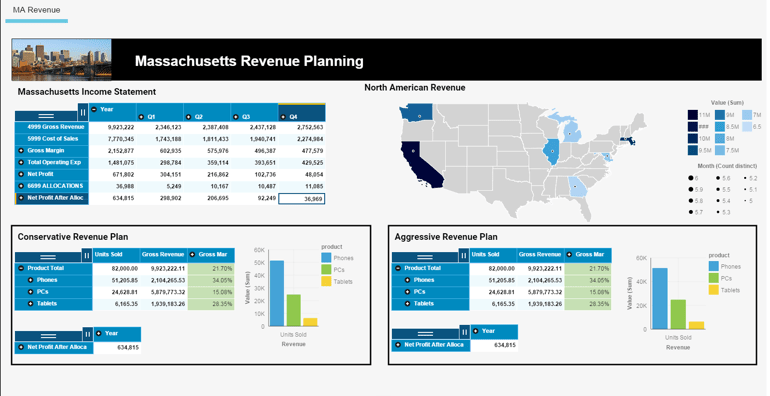
N.B. It is important to know that PAW mapping visualisations support the State level but not City level visualisations yet.
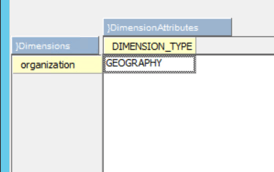
The control cube }DimensionAttributes (seen left) has historically been used to define a dimension as either TIME, HIERARCHY, METRICS or METRICASSESSMENTS. In Planning Analytics, you can now set the element DIMENSION_TYPE to the value ‘GEOGRAPHY’ for the dimension which is the Region or State or Country in your TM1 model.
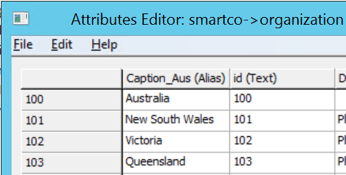
The Geography dimension should have a level or elements that can be recognised as States. More importantly, the states should not be abbreviated. For example, NSW is not acceptable in replacement of New South Wales. We can always have an alias attribute as the full form of the States.
Finally, the cube view should be arranged so that it has the Geography dimension with Region/State/Country dimensions in rows, measure dimension on columns and other dimensions in title region. Save this view and drag and drop it to the PAW canvas. You should then see a map visualisation such as the below:
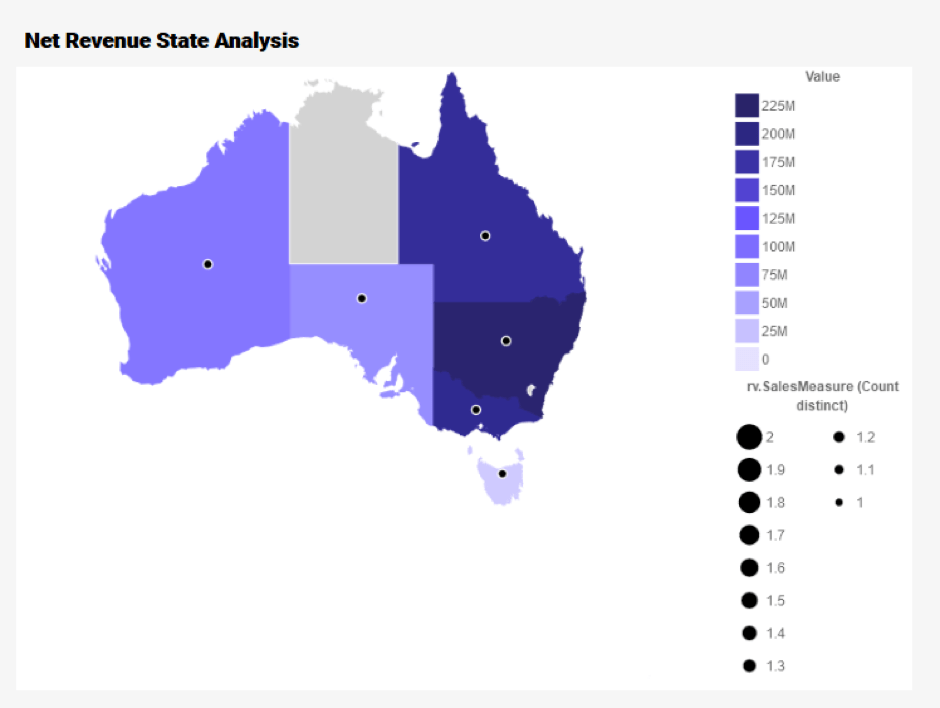
If you would like to see this in action, please take a look at the following video on Tridant’s YouTube channel highlighting how you can create a Map Visualisation in Planning Analytics.
In a dashboard showing KPIs, the radial ring visualisation at the bottom of the dashboard gives the perfect aesthetical feel. However, to obtain this visualisation, it is important to arrange your cube view in a specific manner.

In order to achieve this visualisation, the column dimension should take a single measure, rows should have a single dimension and rest of the dimensions should be in title region. Subsequently, after arranging this cube view, you can see the option “Radial Ring” if the visualisation tab is open.
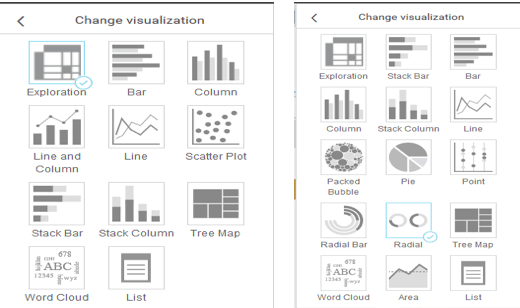
To see a visual demonstration of the two ways of arranging cube view to enable the map visualisation option in Planning Analytics Workspace, please check out the following video.
You could have a time when Planning Analytics has many sheets which contain specific explorations based on business requirements. There is always a need to navigate between those sheets without actually searching for them. There is a new functionality added called 'Navigation Button' which helps to navigate between sheets.

This button enables you to navigate from one sheet to another. The other properties include the general appearance, text properties and button text which can be edited from the properties palate.
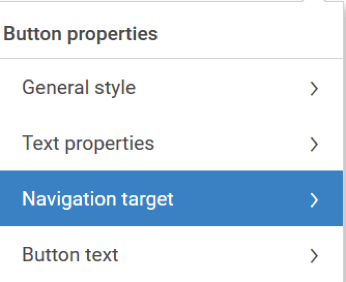
To take a look at a visual demonstration highlighting navigation button functionality and the re-using of objects in PAW, please check out the following link.
One of the great features of Planning Analytics Workspace is linking the contributor application using the webpage tool.

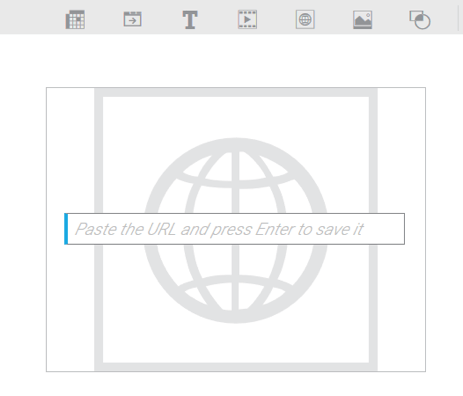
The option is available once you start editing the PAW sheet on the right corner of the screen.
In the PAW canvas when you select the above-highlighted tool, a box appears prompting for a webpage hyperlink. In this box, we can type in the hyperlink. An important tip is that Planning Analytics uses only HTTPS protocol, the usage of HTTP will result in an error.
The Planning Analytics welcome kit, Deep Dive Part 1, will contain a URL to access the TM1 Applications. For example: https://<clientName>.planning-analytics.ibmcloud.com/pmpsvc/
Once the application is deployed, you can access the application via a supported Web browser and by copying in the URL. For instance: https://<clientName>.planning-analytics.ibmcloud.com/pmpsvc/pmpjs/workflow/workflow.jsp?portal=1&aid=%4324
The key thing you need to ensure is that the clientName in the url should be replaced with ‘www’.
Paste this URL and press enter in the webpage tool, you can now see the contributor app opening in PAW with all its functionality.
Have you ever wondered if you could incorporate BI reports in PAW? Absolutely, you can!
Don’t forget to save to the sheet!
To answer all the above questions, IBM’s predictive cloud-based analytic solution: IBM Watson Analytics serves the purpose as shown below.
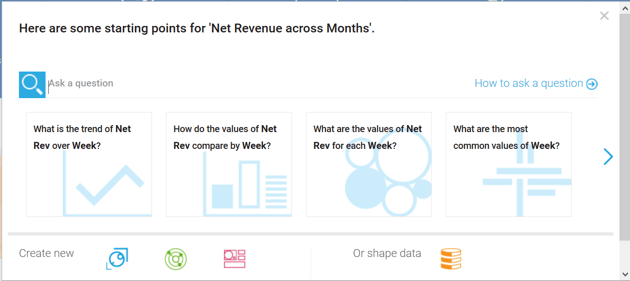
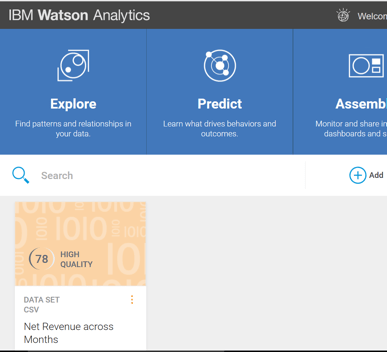
Planning Analytics users have access to Watson Analytics and any exploration brought into the PAW has a “Transfer data set to IBM Watson Analytics” option. Once this option is selected, the dataset is transferred to the location selected which can then be accessed by Watson Analytics for smart data discovery and data exploration with effortless dashboard and infographic creation.
}StatsByRule is a three dimensional cube containing }Cubes, }LineNumber and }RuleStats as Dimensions.
The }RuleStats dimension contains elements such as Rule Text, Total Run Count, Min Time, Max Time, Avg Time, Total Time and Last Run Time which capture key information based on the rule lines. A Total of 10,000 lines of rules code stat can be shown as the }LineNumber dimension has 1-10,000 elements.
}DimensionAttribute is already a known control dimension. However, the Dimension_TYPE element in }DimensionAttributes dimension can take a new value as “GEOGRAPHY” apart from TIME, HIERARCHY, METRICS and METRICASSESSMENTS.
For more information about this or anything related to Planning Analytics, please feel free to contact me on the details below.
Copyright © Tridant Pty Ltd.