
We all know how much effort it takes to update Tableau Server when a new version is launched: planning for the update, creating backups of the server, notifying users for the downtime, perhaps also testing the update in a testing server prior. The list could go on and the update could take up to a day to complete for one single node.
As a Tableau consultant and trainer, I am often asked “When and how often should we update our server?”
I tend to always respond, “When the new available function will hugely benefit your reports”.
8 May 2020 marked the official release of Tableau 2020.2, this year’s second major release. Full list of changes is available here.
This article aims at helping you decide if this version update is the one you are looking for. I played with the beta version of the update for a few weeks and here is my Top 5 list of useful functions:
The improvement, aimed at data savvy users, has changed the way multiple tables are related to each other – by making it more flexible.
It adds the option to create logical tables and add relationships when normal joins and unions do not work, thus allowing many-to-many relationships without causing duplicates, as well as not being as complex as the traditional data blending method.
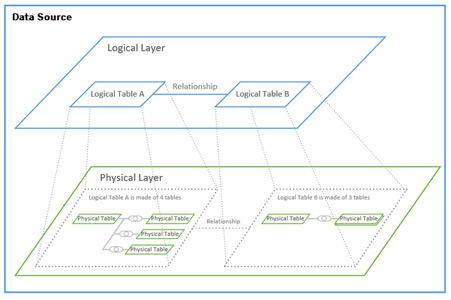
Each logical table can be made of unions (or joins) for your one-to-one or one-to-many relationships, before being linked to another logical table.
This addition means users will have more flexibility when importing data in Tableau, without needing to create views or change the aggregations of tables in the original source.
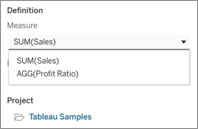
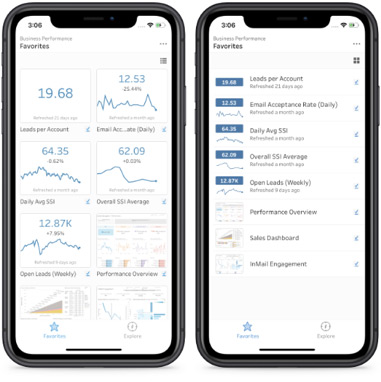
The second addition adds KPI tiles in your Tableau Server/Online project folders. This can be easily accessed or viewed without opening a dashboard and waiting for it to load.
Metrics can easily be added by selecting a measure from your dashboard:
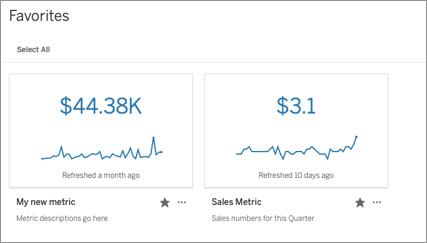
And will then be displayed as a tile/KPI box in your folders:
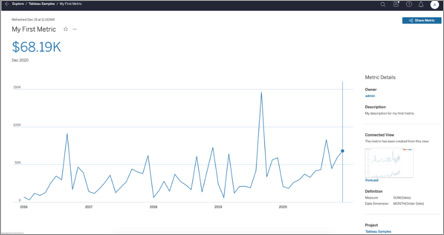
When clicking on the metrics, more details will be displayed:
This feature is particularly useful for checking KPIs when you’re on the move – as metrics display clearly in portrait mode on mobile devices now.
Metrics can be refreshed as often as needed so I am keen to see this implemented for all my clients who are using alternative methods such as landing page style dashboards.
This is a simple yet very useful feature which allows users to upload a workbook directly to Tableau Server/Online via a web browser.
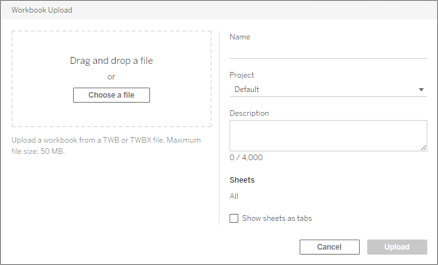
This will be particularly useful to users without a Desktop license who still want to publish workbooks.
More options around Set are always welcome! From conversation with clients, not many have tried this function – perhaps because end users have not found it intuitive to use in the past.
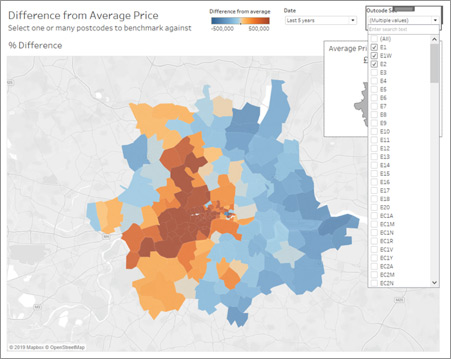
Set Control has fixed this by allowing users to select items to be part of the set in the same way as one would use a filter. Click here to know more about Sets.
Finally, the last top spot is reserved for some minor quality of life improvements which allows users to reorder workbooks they have in favourites.
For users like me who monitor multiple workbooks, it is sometimes frustrating to see that the order of your favourite workbooks does not make sense – and sorting them by name or dates does not help. This feature now allows you to simply drag and drop your favourites in any way you prefer so you can open them in your specific order every day.
I believe the Metrics function alone is a game changer, especially for users on the go who need to quickly check updated figures without having to open a dashboard and wait for it to load.
If you missed Tableau’s last few updates, Animations introduced in 2020.1 is another core addition which could be of interest. Animations enables users to find further insights via a new perspective which could not be seen before: movements.
Raymond Chan | Michelle Susay
Copyright © Tridant Pty Ltd.