
Power BI stands for "Power Business Intelligence." It is a combination of "Power," which implies strength and capability, and "BI," which stands for "Business Intelligence." Power BI is designed to provide powerful tools and capabilities for business intelligence and data analysis, enabling users to gain insights and make data-driven decisions to improve their business processes and performance.
Microsoft Power BI is a Business Intelligence (BI) Dashboarding and Reporting platform that provides powerful data and analytics capabilities, that can be tailored to any business user.
It’s garnered a well-deserved reputation as one of the top performers in this space and is known for providing more meaningful insights through end-to-end solutions and highly customisable data visualisations.
It features over 200 out-of-the-box, native data source connections, powerful programming languages through Data Analytics Expressions (DAX) and M Query, an extensible visualisation library, and enterprise features such as Deployment Pipelines, Dataflows, and more.
Power BI Desktop is a free application that allows users to connect to a wide range of data sources, explore data, build data models, create and publish reports. There are both free plans, which contains limited features, and paid plans, including Power BI Pro and Power BI Premium which have many more capabilities.
View the costs and capabilities of each plan here.
DAX stands for Data Analysis Expressions. It is a formula expression language. It can be applied to Microsoft Power BI, as well as other Microsoft tools such as Azure Analysis Services, Power Pivot in Excel.
DAX allows users to perform a wide range of data manipulation and analysis tasks, such as creating calculated columns or calculated tables, and measures. It is particularly useful for tasks like creating custom calculations, defining business logic, and performing advanced and effective calculations on the data.
Here’s a simple guide to help start with using Power BI desktop:
1. Install Power BI desktop. Type in browser: https://powerbi.microsoft.com/en-us/desktop/ to visit the Power BI Desktop download page -> Click on the prominent Download free button. It will automatically navigate to Microsoft App Store if the computer system is Windows 10 or later -> Run the installation file.
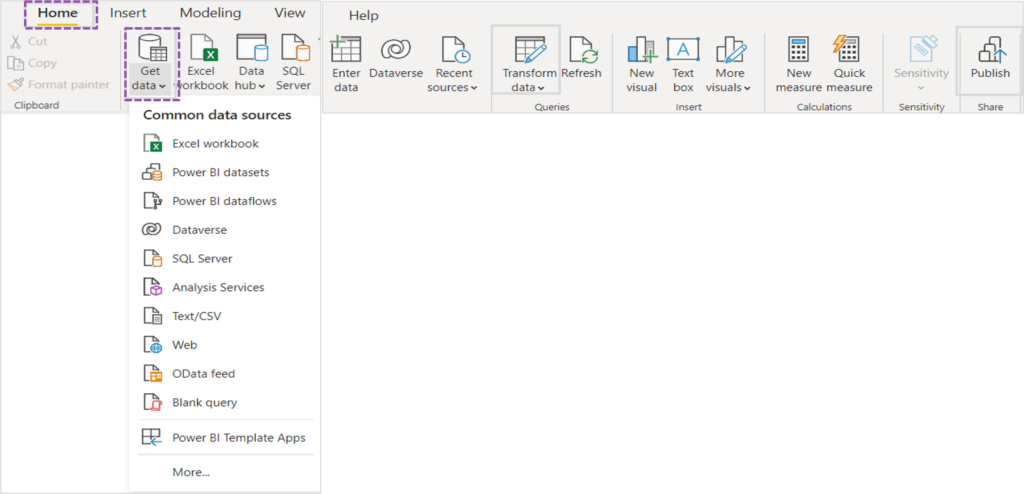
2. Connect to data sources. Launch Power BI Desktop on local computer -> Sign in using Power BI credentials -> Click on the Get Data option to load different data sources, including csv, excel, dataflow, database, etc.
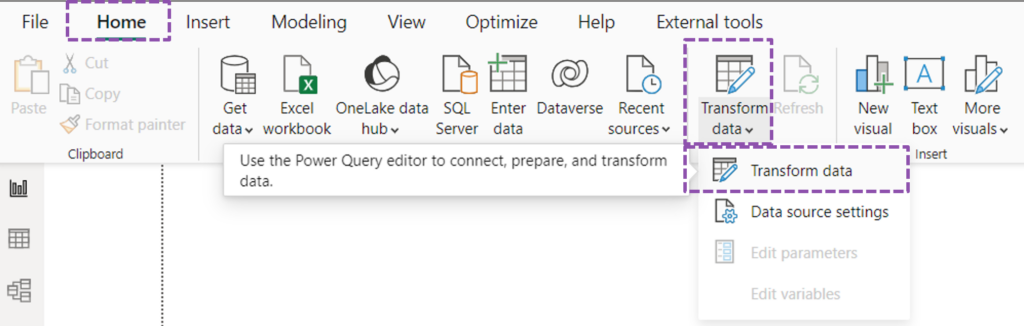
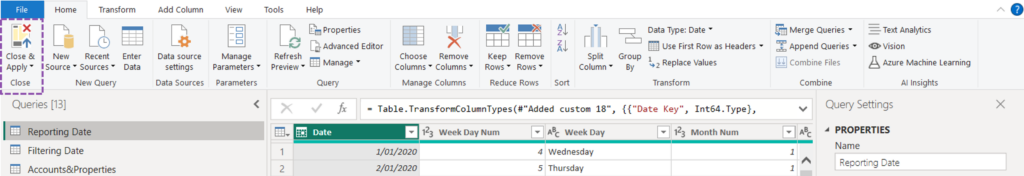
3. Transform and clean data. Click on Transform Data, the Power Query Editor will open. Rename columns, fill empty value, merge queries, pivot data, etc. are included in this process.
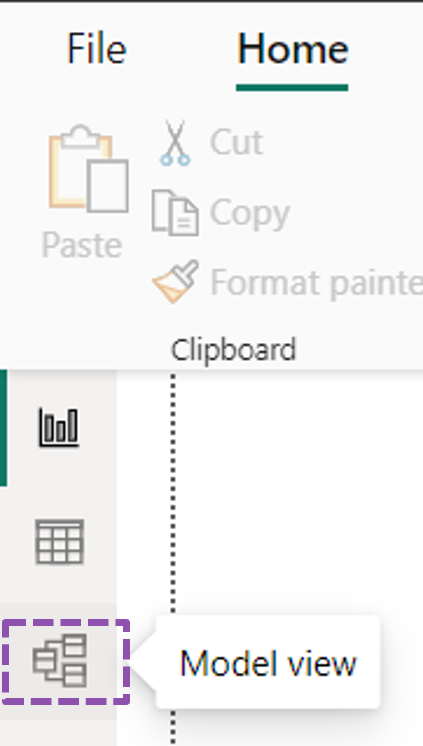
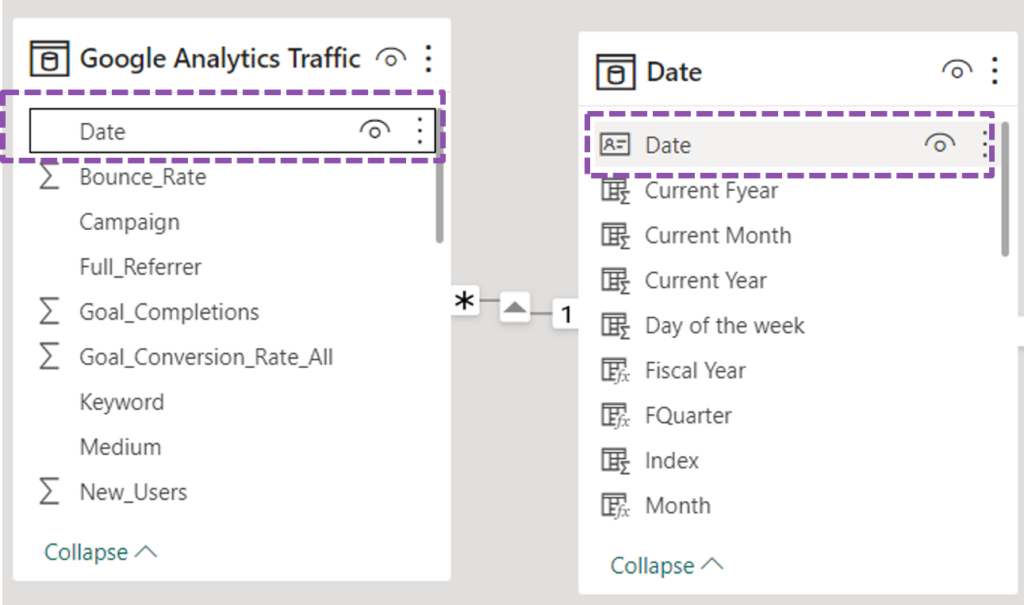
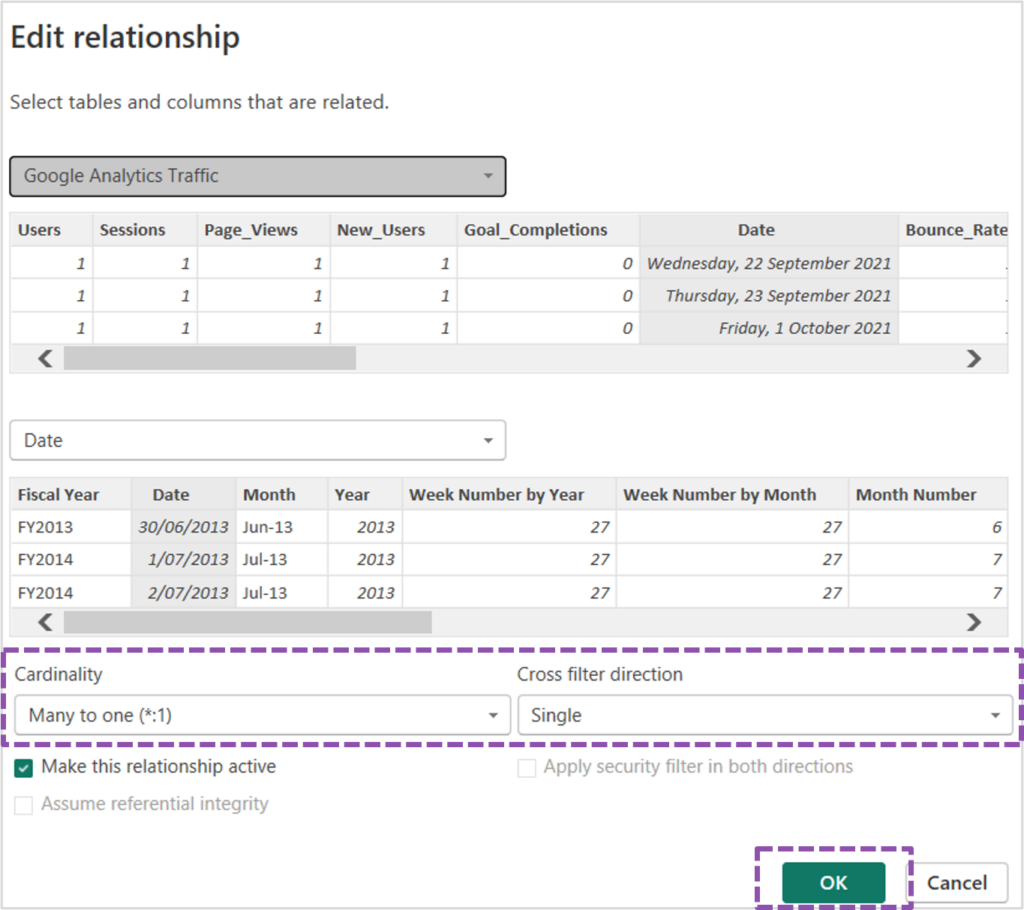
4. Build model. click on the Model view icon on the left panel to see the tables that have imported along with relationships. Double-click on the relationship line to open the Manage Relationships dialog. Define the cardinality (one-to-one, one-to-many) and cross filter direction (both, single) for each relationship.
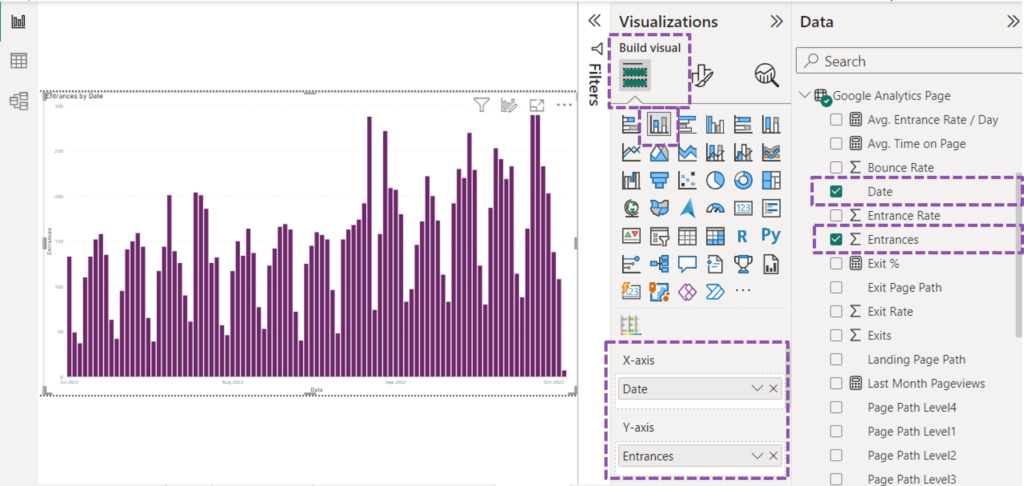
5. Create dashboards. Drag and drop fields onto the report canvas to create visualisations like charts, tables, maps, and more. Use filters, slicers, and drill-through options to add interactivity to dashboards.
Creating a dashboard in Power BI involves several steps:
Connect to various data sources, such as Excel files, databases, online services, and more by opening Power BI Desktop application -> Navigate to Home ribbon -> Click on Get data -> Choose the desired data sources.
Under Home tab -> Click on Transform Data. The Power Query Editor will open, allowing to clean data as needed, for instance, rename tables or columns; change data type; fill empty values; remove or add columns; merge queries. Click on Close & Apply after shaping the data.
Some resources to help to get started and become proficient in Power BI:
The time it takes to learn Power BI can vary significantly depending on several factors, including the prior experience with data analysis, the depth of knowledge that users want to acquire, the amount of time that can be dedicated to learning, the overall familiarity with similar tools and concepts, and the complexity of the dashboards that you wish to create. Here are some general guidelines to consider:
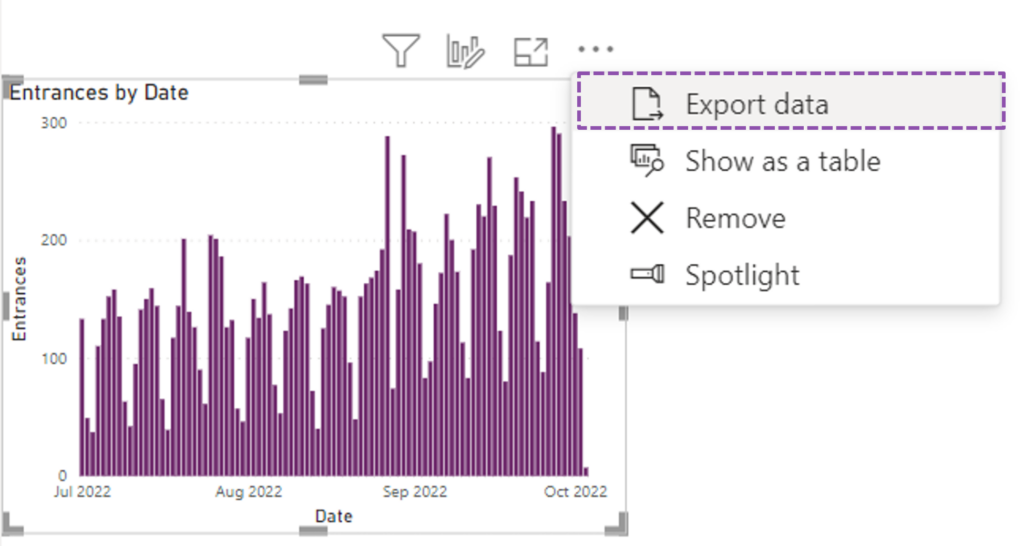
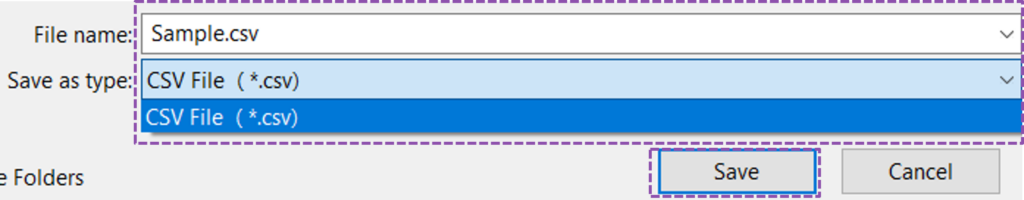
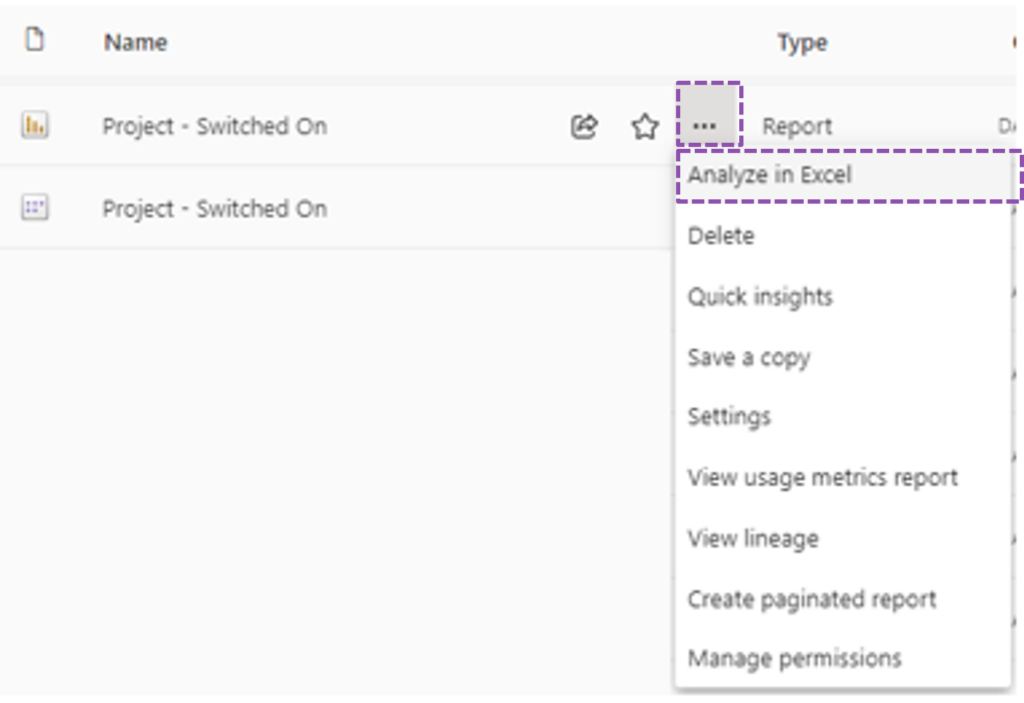
There isn't a direct way to export a Power BI report to Excel. However, users can export the underlying data from a Power BI report in multiple ways.
[hubspot type="form" portal="2475762" id="4be1c442-5efa-482f-a46e-1b12d3fbf349"]

Copyright © Tridant Pty Ltd.