The questions should also be asked and considered within each area of your business.
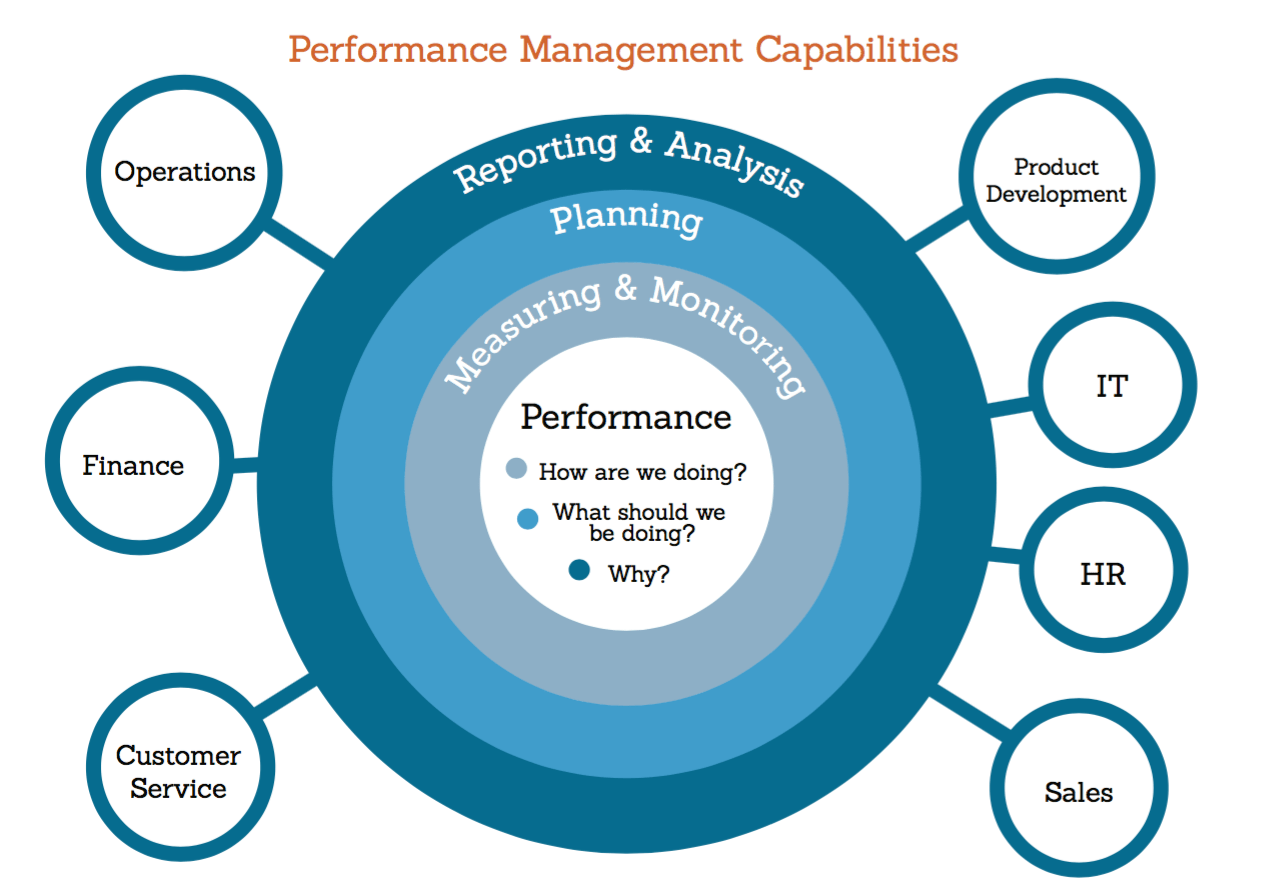
Some modern day visualisation tools are single singular in their viewpoint and only really answer 2 of the 3 questions, How are We Doing and Why.
To complete the loop, it’s important to be able to answer the “What Should we be Doing” question and then feed it back i.e. set targets and forecasts and then push out into reporting analysis.
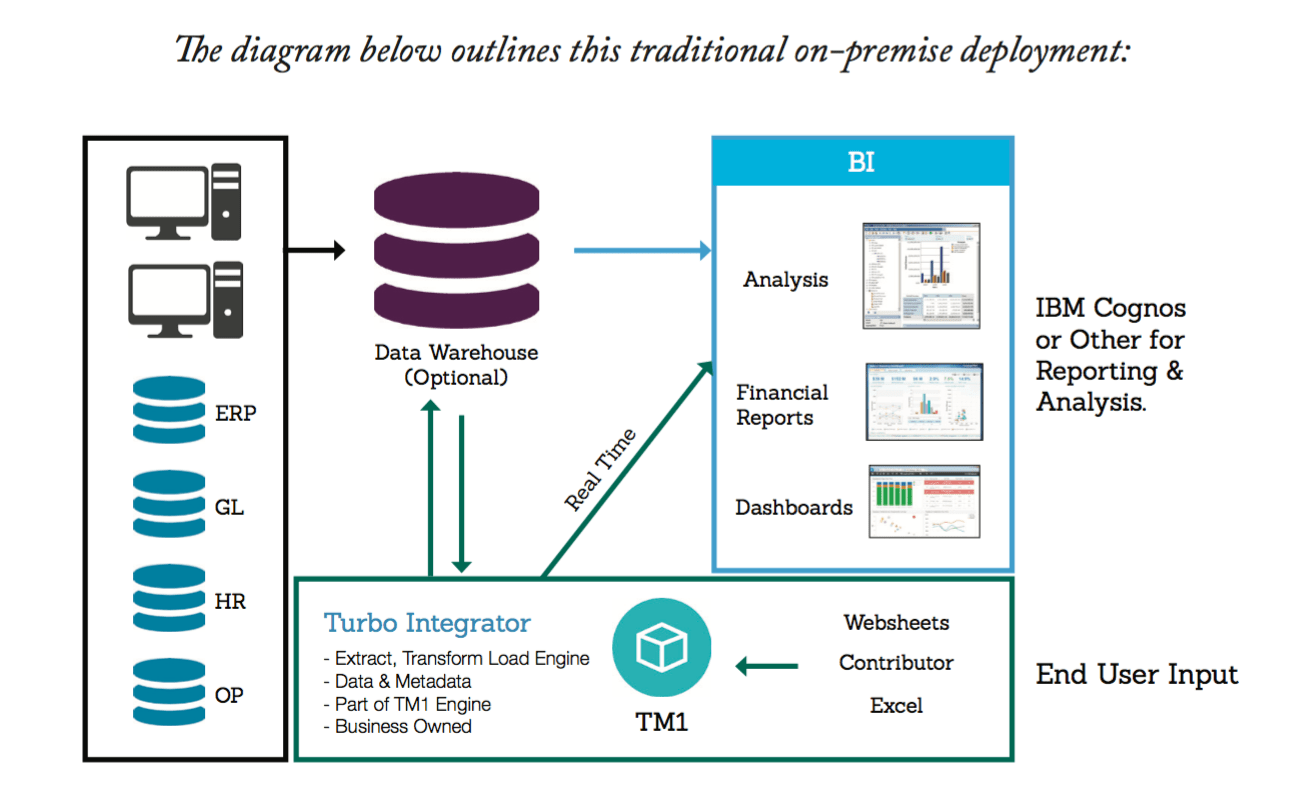
In the traditional on-premise model of an IBM solution, you would typically deploy a data warehouse to collect data from source system Cognos BI, and then to create reports to answer the How and Why questions with then TM1, to then answer the “What Should we be Doing?”
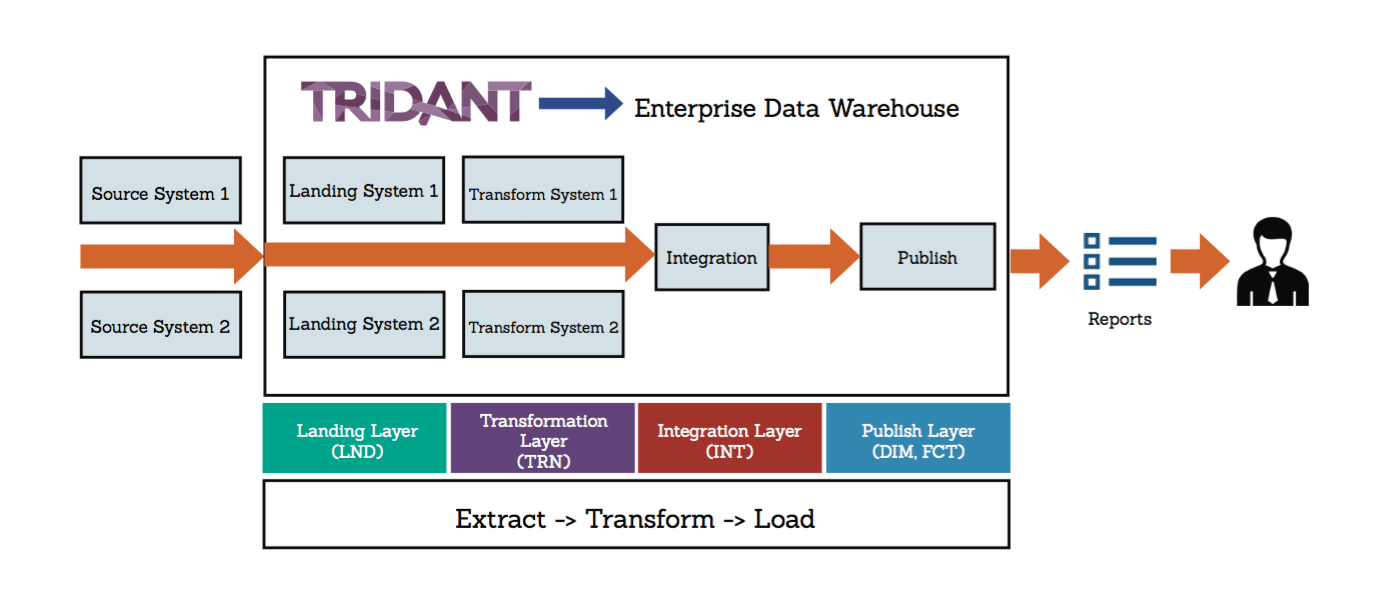
Traditionally the data warehouse has been integral to the reliability of numbers being used in BI reporting and analysis. At Tridant, we have successfully deployed many data warehouses, integrating source systems together across a Landing, Transform, Integration and Publish layer as per the below diagram:
We have entered into a new phase in the BI world, where customers now exist in a hybrid cloud model. Some systems may be on-premise and some systems may be off-premise in the cloud. Your data warehouse, BI or TM1 could be in the cloud, on-premise or any combination of these. Most likely, you will be in a combination scenario as you transition components to the cloud one-by-one.
So, it’s time to consider a more modern architecture for your data warehouse, BI and TM1 solution. Let’s consider a scenario where you have on-premise and cloud-based source systems, but you still want a single source of truth for your data to answer the How, Why and What questions.
The components of the total solution we will be using for this modern approach are:
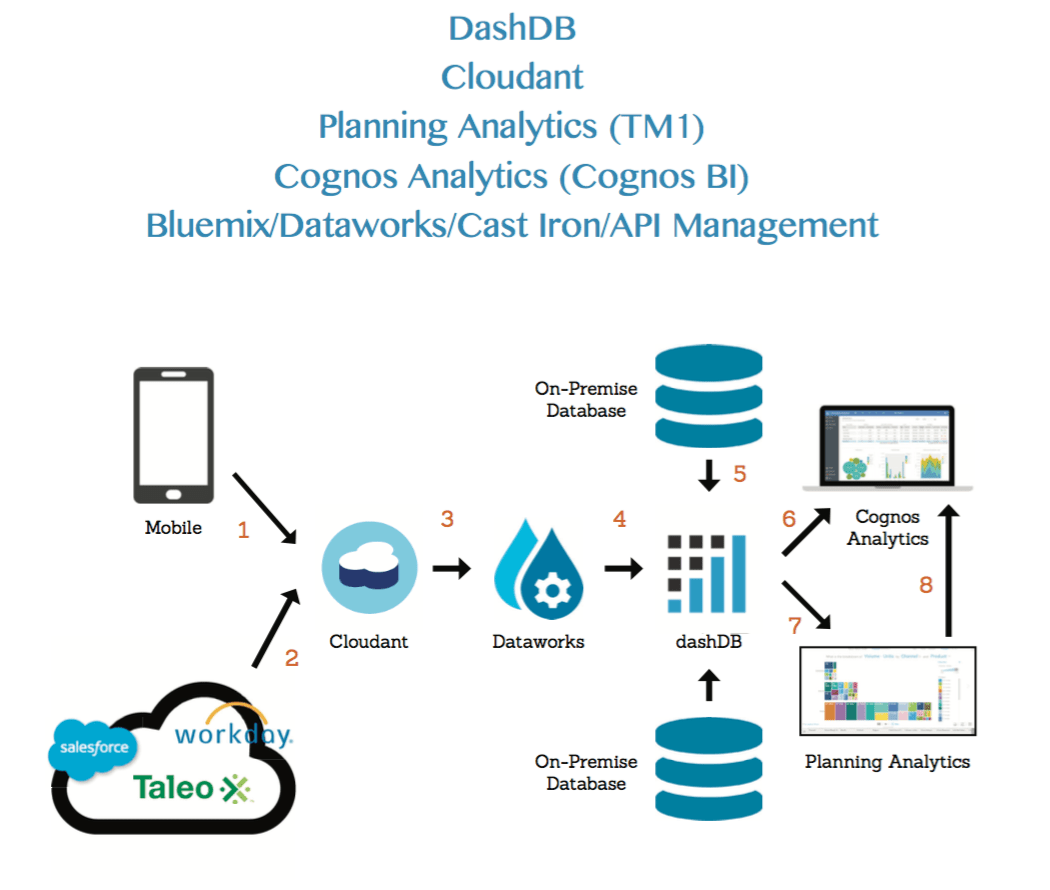
The diagram above represents the different parts to the overall solution and we will step through each in order:
1) Most organisations now have a mobile strategy in place for providing Apps to customers and users within their organisation. IBM Cloudant is a great back end for mobile applications with its geospatial and synch capabilities.
2) Salesforce is one of the most recognised SaaS products out there today but there are many other SaaS solutions that Line Of Business are taking advantage of. These SaaS products typically still need to be presented in dashboards to provide a complete picture of your company performance. SaaS systems are typically accessed by APIs and typically return the data in the form of JSON syntax. Cloudant is a great database for storing unstructured data so instead of having to parse the JSON or do any transformations you can just store the raw API results.
Major SaaS products like Salesforce, SugarCRM, Workday plus major ERP systems like SAP, JDE etc are all available within IBM Cast Iron as datasources. Cast Iron allows for drag and drop formation of workflows connecting systems together via pre-built API connectors. Instead of writing custom java/javascript code to extract data from SaaS you can let Cast Iron do the work for you in a fraction of the time and the great thing is anyone can quickly visualize the flow and data. So why not use Cast Iron to connect to your datasources and extract the data in JSON and then store it in Cloudant or get it to convert JSON to XML and store in a traditional relational database format.
3) IBM Dataworks is a relatively new offering within Bluemix. You may have seen it if you have used Watson Analytics for importing data.
4) The great thing about storing data within Cloudant is that it’s so easy to publish the data needed for reporting in DashDB. Think of DashDB as the database you want your BI reports to come from. What Dataworks will do for you is natively work with Cloudant to move your unstructured data from Cloudant into DashDB. When in dashDB, the data will then be structured, ready for reporting and analysis.
5) dashDB is a data warehousing and analytics solution in the cloud. You use dashDB to store relational data, but it’s powered by IBM BLU Acceleration and Netezza, making it extremely fast.
6) Cognos Analytics is the new version of Cognos BI built for dashboarding and reporting. DashDb is an integrated datasource for Cognos Analytics.
7) Planning Analytics is the latest version of TM1 in the Cloud. There are a number of options for loading data into your TM1 cubes with Planning Analytics. The great thing about the above architecture, is that you can load data via odbc using the Bluemix Secure Gateway or use traditional text file uploads or IBM Cast Iron to update TM1 with data from native connectors via the Rest API.
8) Since Planning Analytics (TM1) allows you to use ODBC to connect to a data source, and DashDB can be queried via ODBC, it will mean that your entire suite can be hosted in the cloud.
This is just one of the articles published in our quarterly magazine, 'The Dashboard'. If you would like to see more then please subscribe to our mailing list here.
Copyright © Tridant Pty Ltd.