
Power BI Slicers are important and useful visual elements for users in Power BI reports. The Power BI Slicer is a type of on-canvas visual filter that enables sorting and filtering of a packed report, allowing the user to view only the information they desire. Unlike filters, the slicers are presented as a visual on the report and allow the user to select values as they are analysing the report.
Common use cases for slicers:
Types of slicers:
Image-Based Slicers:
Images or pictures are very powerful to identify sets of data. We can take user experience to the next level by using images on the slicer.
There are two options in Power BI for image-based slicing:
Let us take an example of product sales data for different countries and we want to filter data according to the selected country. We need to add a Country Slicer to the report and by adding Flags to the slicer, it will be more user-friendly than displaying text.
Let’s see how we can achieve this in Power BI:
Step 1: Save the image address which you want to display on the slicer:

Image address should be in the below format:
Example: https://www.worldatlas.com/r/w960-q80/img/flag/ca-flag.jpg or .png
Step 2: Create a table in your report with column name and corresponding URL’s as:
Table name: Images
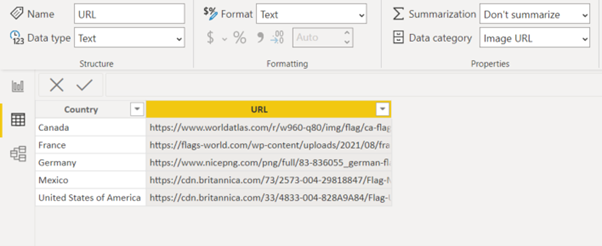
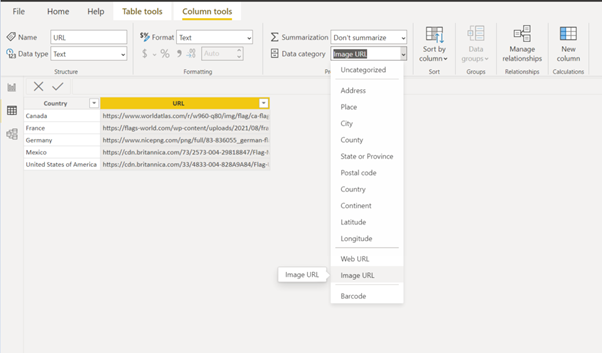
Step 3: Change the data category of address/URL column to “Image URL” as:
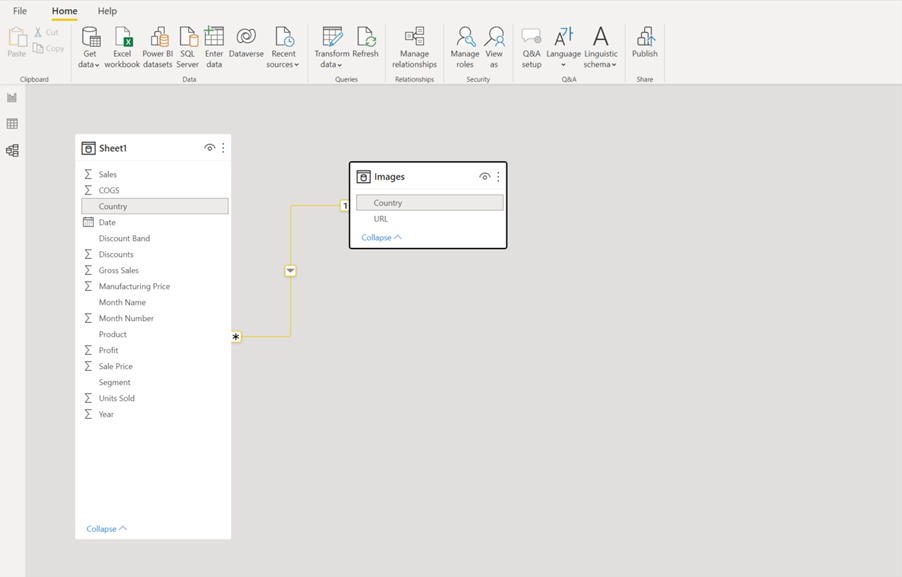
Step 4: Link the Image table to the appropriate table in the model using key column in the data model tab to filer the data as:
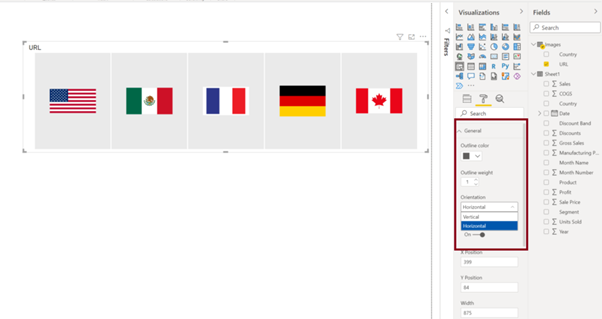
Step 5: Add slicer to the report page and add URL column to the field as:
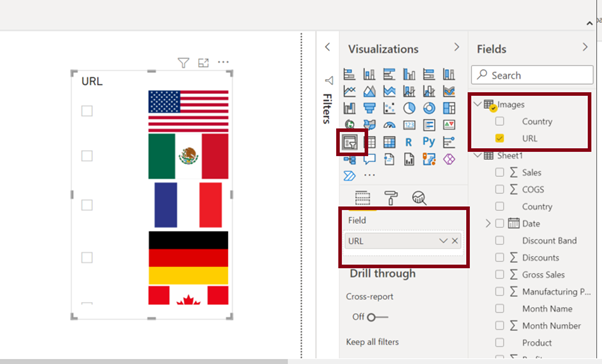
Step 6: Change slicer orientation to ‘Horizontal’ as:
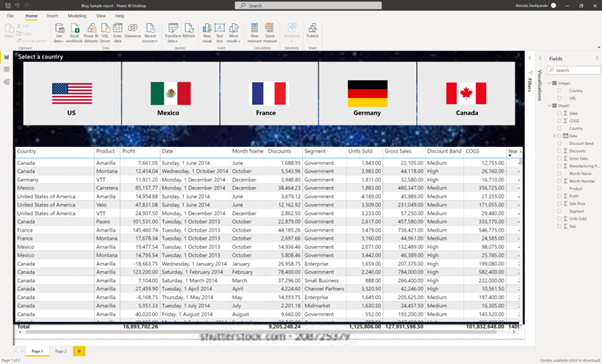
Step 7: Add visuals to the report as required and filter the data on visual as per the slicer selection.
Visual for all countries:
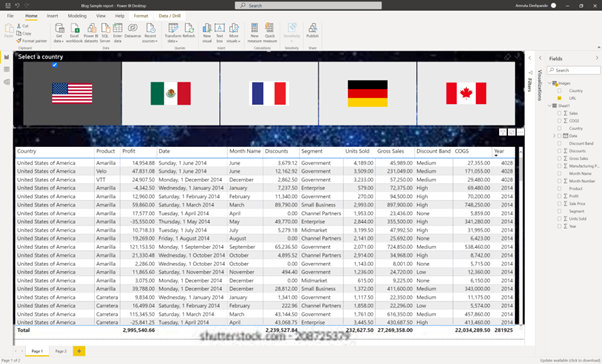
Visual after selecting US:
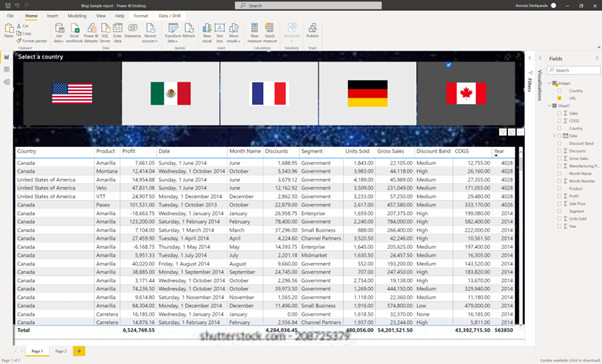
Visual after selecting multiple countries US and Canada:
Step 1: Import a Chiclet slicer from the extended Power BI gallery.
Step 2: Add an Image table with the field and corresponding URL/link/path
Step 3: Link the image table to the relative table in the data model tab
Step 4: Insert Chiclet slicer into the visual and add the appropriate category and field option.
Image-based slicers are a great visual filtering mechanism that requires little effort to set up in Power BI. They allow users to more efficiently and effectively analyse large data sets through the use of visual imaging as opposed to text. Contact us to learn more about using image-based slicing within Power BI to improve your business operations.
Copyright © Tridant Pty Ltd.